

Google’s primary contributing factor to consider a website “good” depends solely on user experience: site speed, visual stability, and other page experience signals.
Ultimately these components, encompassed in the Core Web Vitals scores, are what Google considers as ranking factors.
It starts by taking into account the bounce rate of a website —which is the time spent on a website before a web visitor clicks off.
There are several reasons that could lead to you having a low or high bounce rate, but page speed is the number one determinant.
Now, how fast or slow your website loads directly correlates to its impact on your conversion rate.
Typically, a fast website gives a good conversion rate —and a bad one does the opposite.
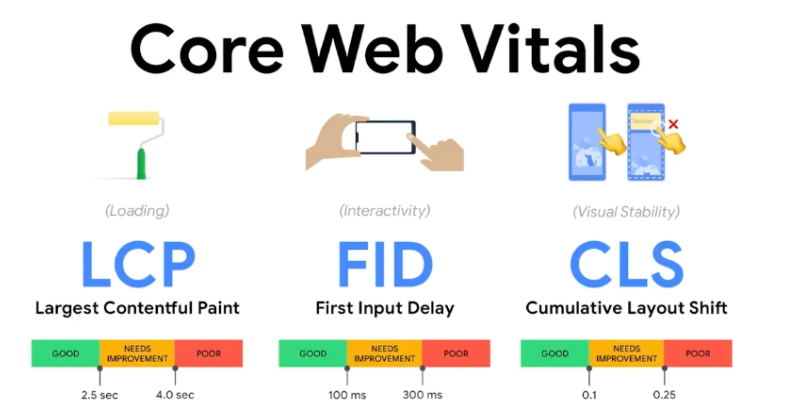
What makes up your page load time is based on three Core Web Vitals metrics, namely;
- Largest Contentful Paint (LCP)
- First Input Delay (FID)
- Cumulative Layout Shift (CLS)
Here, we’ll cover LCP and its impact on your website.
What is Largest Contentful Paint (LCP)?
Largest Contentful Paint (LCP) is a metric that measures the time it takes the largest content block or content element to become visible in the viewport. In other words, it’s a measurement of how long it takes for a web page to be readable by a user.
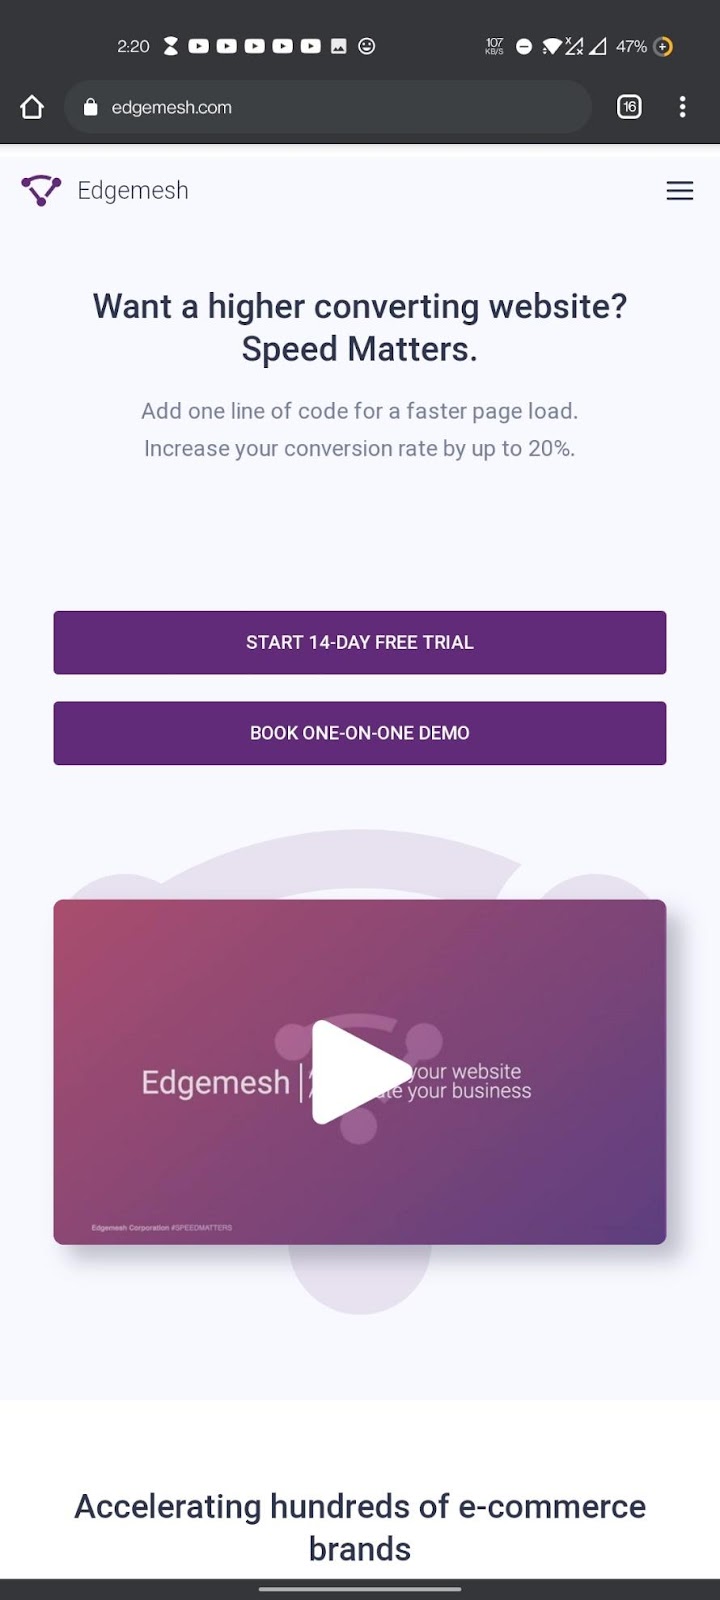
Here’s a quick example of what it looks like:
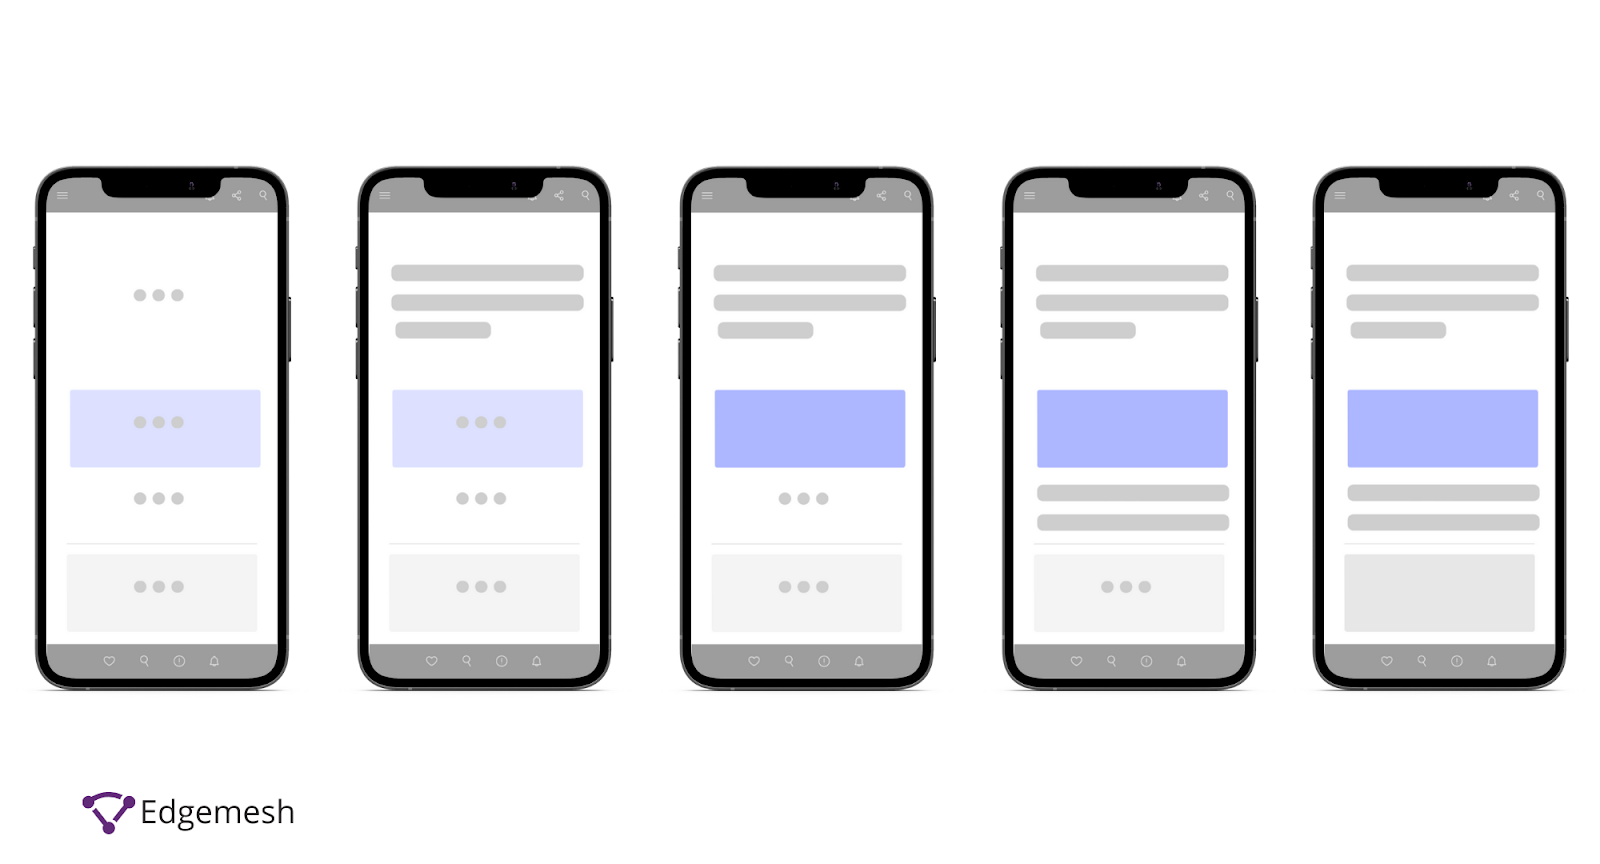
Unless the LCP loads, the user will most likely not see anything on the web page. This is because LCP is always above the fold i.e., the content you see without scrolling. For site owners, the LCP is a critical metric as this is the time it takes before you can present your product page (long before user interaction).
The LCP is one out of the three metrics of the Core Web Vitals update released by Chrome Lighthouse in May 2021.; First Input Delay (FID), and Cumulative Layout Shift (CLS) are the other two.
According to Google, the introduction of LCP is based on understanding the interaction between web visitors and the websites they visit i.e., their page experience.
Google employee Cheney Tsai, while answering questions on Core Web Vitals and Page Experience, talks more about how Core Web Vitals play a role in page experience:
Q: How does page experience ranking work with respect to the published guidance on what values for Core Web Vitals are considered in the “good” threshold?
A: The guidance for LCP, FID, and CLS (the Core Web Vitals) each outlines a specific value that constitutes a “good” score. Because closer to zero is better for all of these particular metrics, we can speak in terms of any score between zero and the documented value (inclusively) as being the “good range.”
This translates to — if your LCP is bad, it’s going to result in poor page experience, which leads to high bounce rates , low conversion rates and lower search rank
Why is this?
Simple, think about how long you’re willing to stare at a blank page on a website, waiting for it to load. Or perhaps the last time you exited a page because it took a long to load.
If you’re like 1 in 4 web visitors who exit a page after a 4-second delay in page speed, that should already tell you something.
You and I are the web visitors that don’t like hanging around waiting for the first image, text, or video to pop up. We need it as quickly as possible.
Which begs the question:
What Is a Good LCP?
Any LCP of a website below or equal to 2.5s is considered good.
- If it’s below or equal to 4s — Needs improvement.
- If it’s higher than 4s — Poor.

According to Google’s Core Web Vital Report, the labels “Poor, Needs Improvement, and Good” is dependent on the URL’s status and device type.
- A URL on mobile with Poor FID but Needs improvement LCP is labeled Poor on mobile.
- A URL on mobile with Needs improvement LCP but Good FID is labeled Needs improvement on mobile.
- A URL on mobile with Good FID and CLS but no LCP data is considered Good on mobile.
- A URL with Good FID, LCP, and CLS on mobile and Needs improvement FID, LCP, and CLS on the desktop is Good on mobile and Needs improvement on desktop.
Nonetheless, to improve user experience, conversion rates and reduce bounce rates, Google recommends you aim for a 2.5s LCP at least 75% of the time on your website.
How does LCP Work?
The scores allocated to each website’s LCP work by measuring the render speed of the largest content elements on a page once a user requests the page from their browser.
Let’s break this down.
When a user types in a web address of a website on their browser, it sends a request to the server to which that address is located.
- In this case, let’s use our website, Edgemesh.
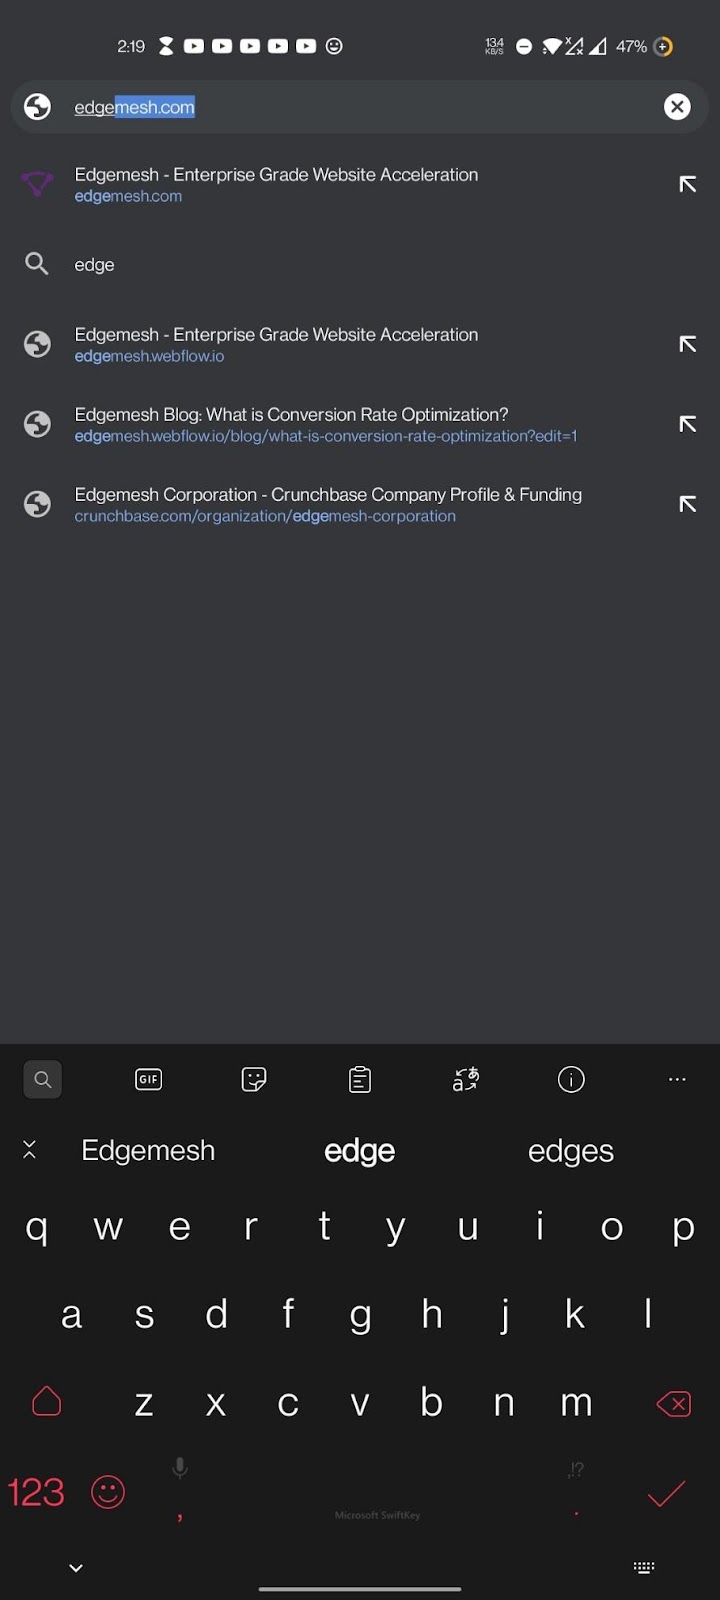
Upon receiving this, the server sends back the results in the form of a web page back to the user.
As the user receives this from the server, Google takes a look at the sizes of multiple content elements shown to the user.
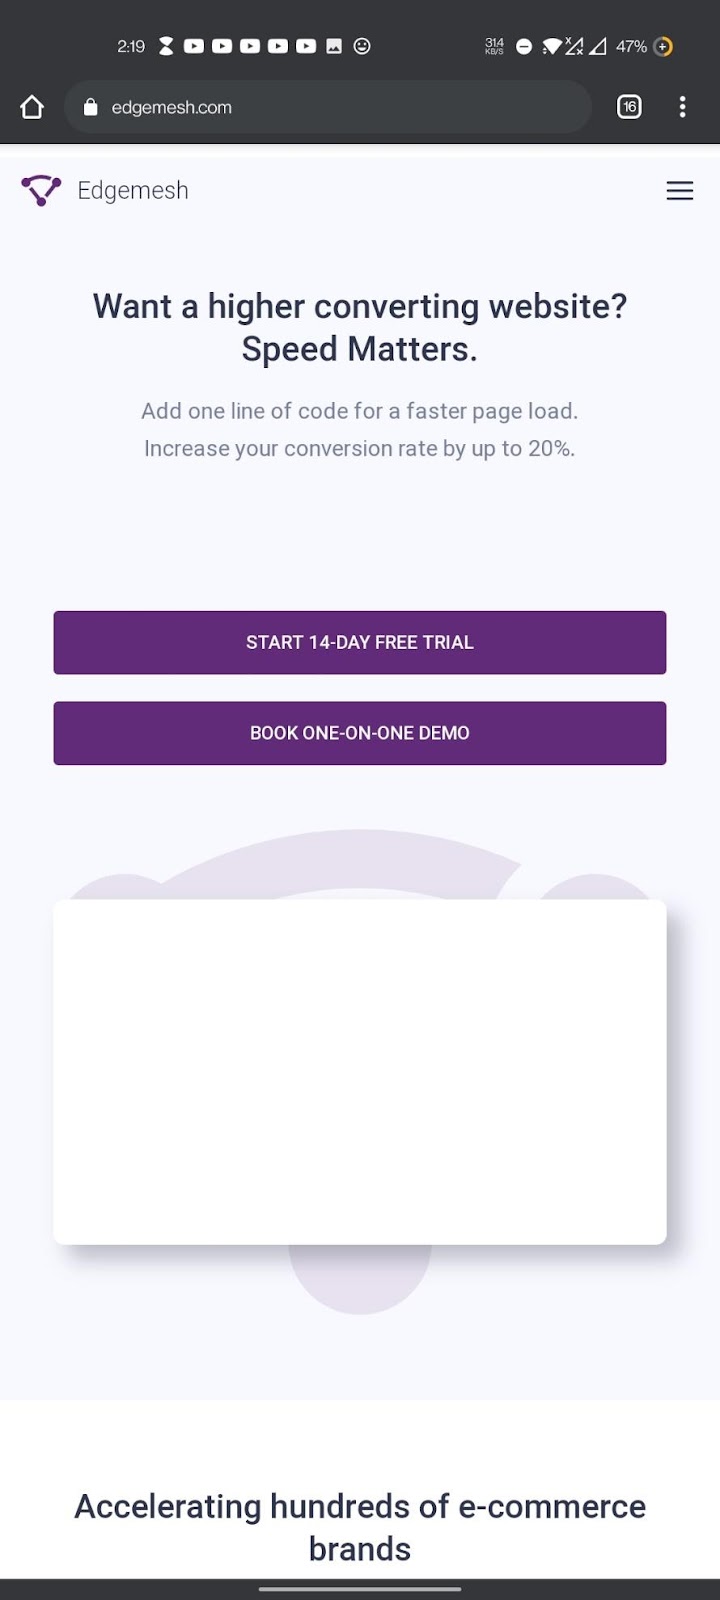
What you’re seeing above is called the First Contentful Paint (FCP), not the LCP yet as it’s not the biggest.
Once it identifies the biggest one, it starts a countdown on how much time it takes for that content element to render.
—In the case of our website, it’s a video.
Now, depending on the website and device (mobile and desktop), the elements considered for LCP are:
- <image> elements inside an <svg> element.
- <img> elements.
- <video> elements (the poster image used)
- Block-level elements containing text nodes or other inline-level text elements children.
- An element with a background image loaded via the url() function (as opposed to a CSS gradient).
On the other hand, in determining what contentful element is the largest to report, the LCP adheres to some rules:
- The CSS padding, margin, or border doesn’t affect the element sizer.
- For text elements, the smallest rectangle that fits all text nodes is considered
- For images that are resized, the size that’s considered is either intrinsic size or visible size —whichever is smaller.
- For elements that extend outside of the viewport, only the portion visible in the viewport is considered.
—Source: Onely
How to Find and Measure your LCP?
There are several tools available to find and measure the Largest Contentful Paint element on a website. These tools are divided into two parts namely:
- Lab Data Tools
- Field Data Tools
Lab Data Tools
These are tools used to measure LCP through performance simulations done by algorithms. 3 of the best-recommended tools to help you do this are:
Field Data Tools
These are tools that are used to measure LCP directly on the website. The most recommended tools to help you do this are:
You’ll either use the field or the lab data tool. Two things to keep in mind:
- Lab data mainly determines the overall score of your page speed or page load time.
- Field data shows you how users experience your website.
Now, any of the listed tools here will do the job of helping you find your LCP.
But to help you better understand what you’re looking for, we’ll pick two.
- PageSpeed Insights
- ChromeDevTools
How to Use PageSpeed Insights to Find Your LCP
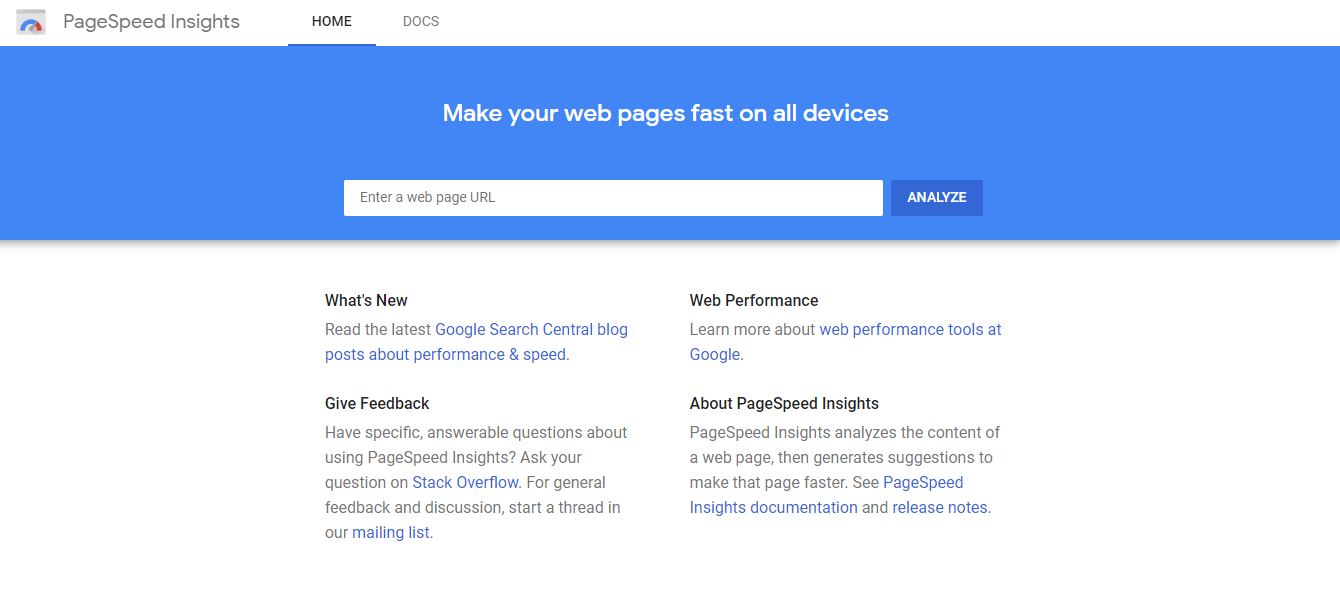
- Your first step is to head over to PageSpeed Insights — and you should have something like this below.
- Input your web address —or any functioning website address you’d like to know its LCP and click on “analyze”.
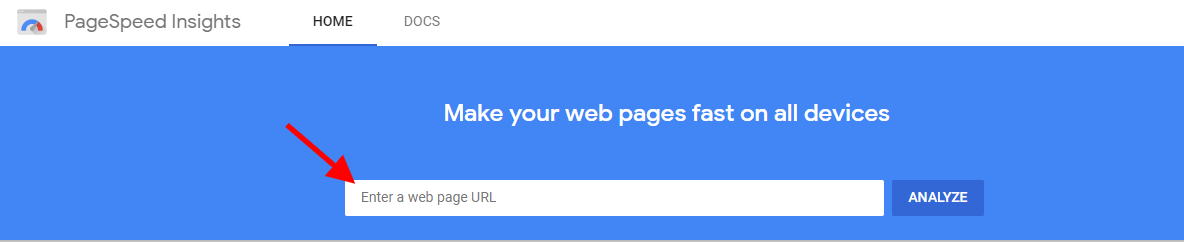
For this, we’d be using our website again, Edgemesh.

- When using PageSpeed Insights to get your LCP, you can toggle between knowing the score on mobile and desktop.

The reason for this is the difference in user experience on different devices. Factors such as page load time, page size, website content, etc. also contribute to this.
- Scroll down and you’ll get your LCP score (Field Data).
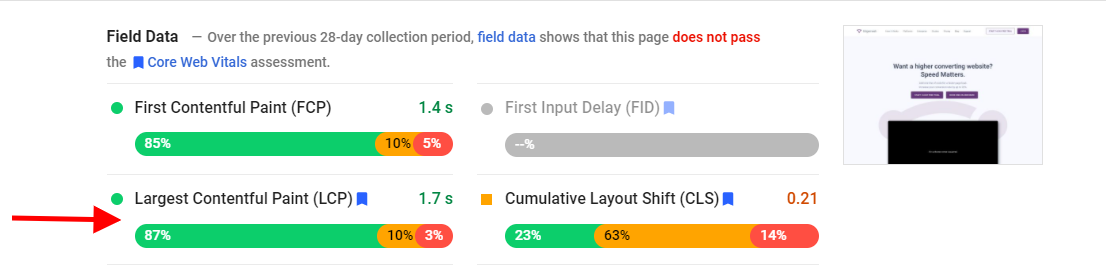
However, even though PageSpeed Insights is used as a Field Data tool, it can also be considered a part of Lab Data tools.
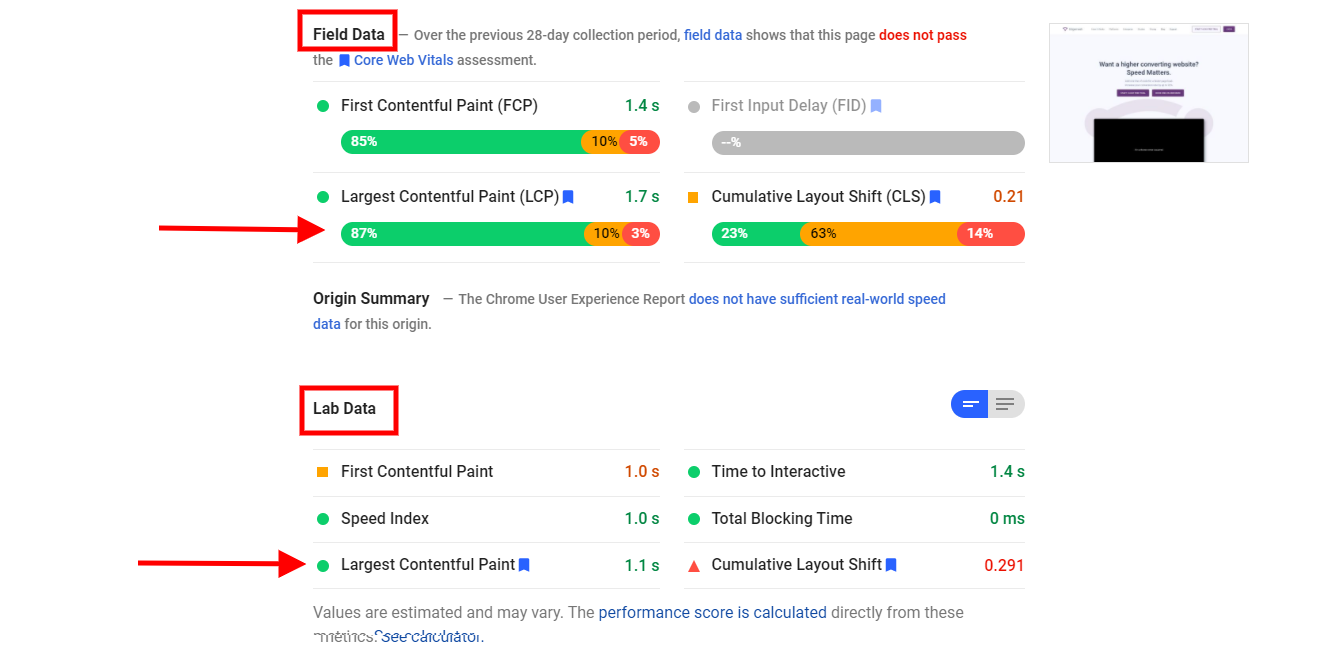
Looking at both scores, you’d notice some disparities in their numbers.
Your next thought might be — Is it normal to have such disparities since we’re measuring for the same thing?
Yes! It's normal to have such disparities.
Like I said earlier, the data you get from using field tools are a result of real-life experiences by real web visitors. These users all have different internet connection speeds, hardware, memory, GPU, CPU, latency, location, etc., all of which play a role in contributing to disparities in the scores. You can also view this data inside the Google search console.
How to Use ChromeDevTools to Find Your LCP
The ChromeDevTools is an inbuilt section of the chrome browser that records the LCP of your website.
- Open your chrome browser on your desktop and go to the web address of where you want to measure your LCP and access the performance tab.
- If you’re using Windows, use these combinations — CTRL + SHIFT + I
- If you’re on a Mac, use these combinations — CMD + OPT + I
You should have something like this if you did it correctly 👇
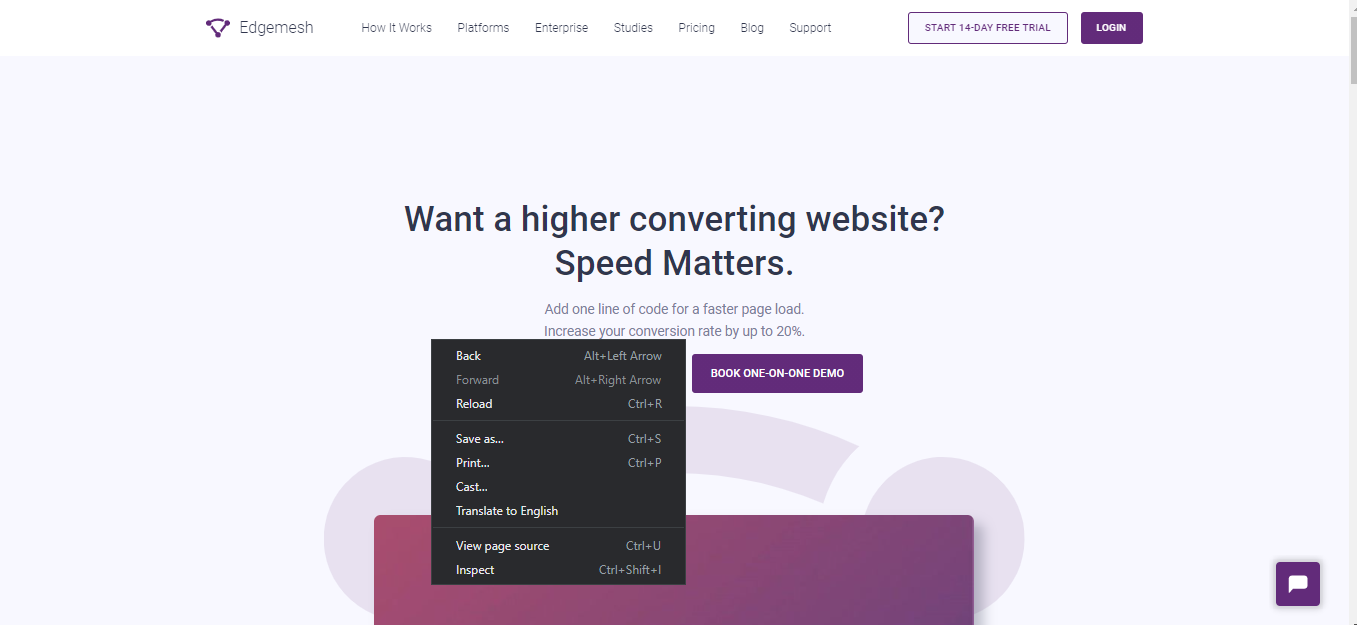
Another easier way to access the performance tab in chrome is by right-clicking on the web page you want to track—then scroll down and click “Inspect”.
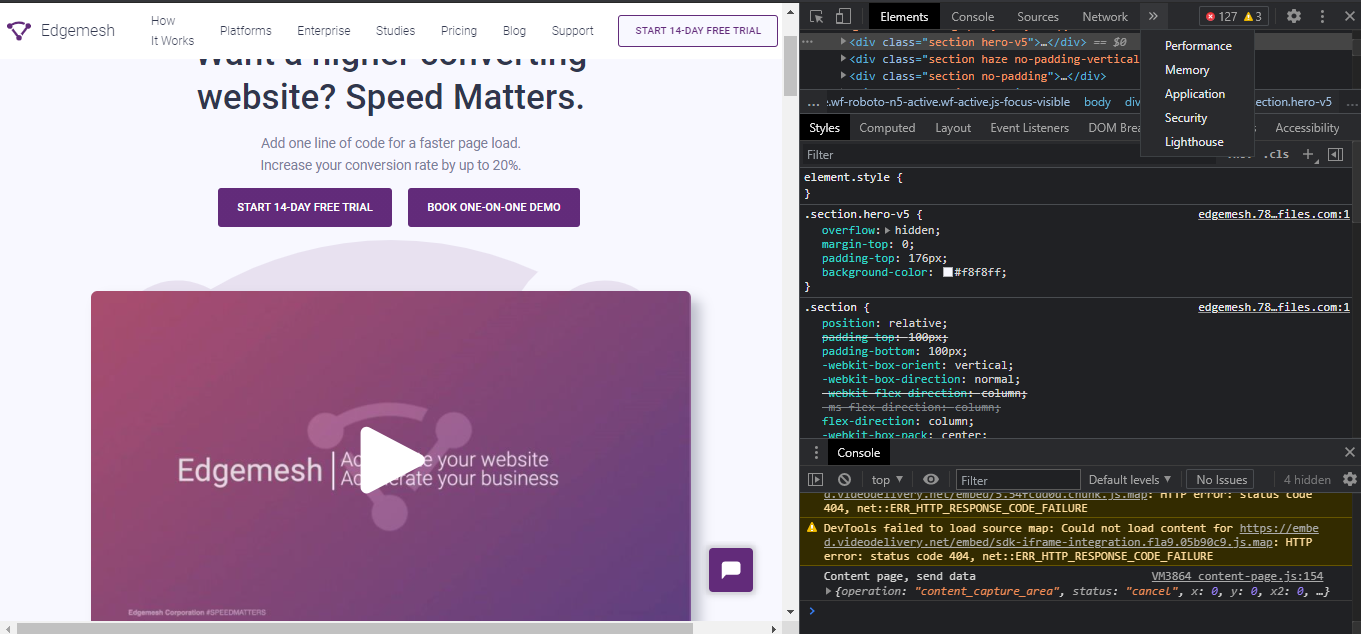
- After opening this on your chrome browser, go to the “Performance” section at the top of the tab you opened.
- If you don’t see the performance section immediately when you open this tab, click on the “>>>” icon.
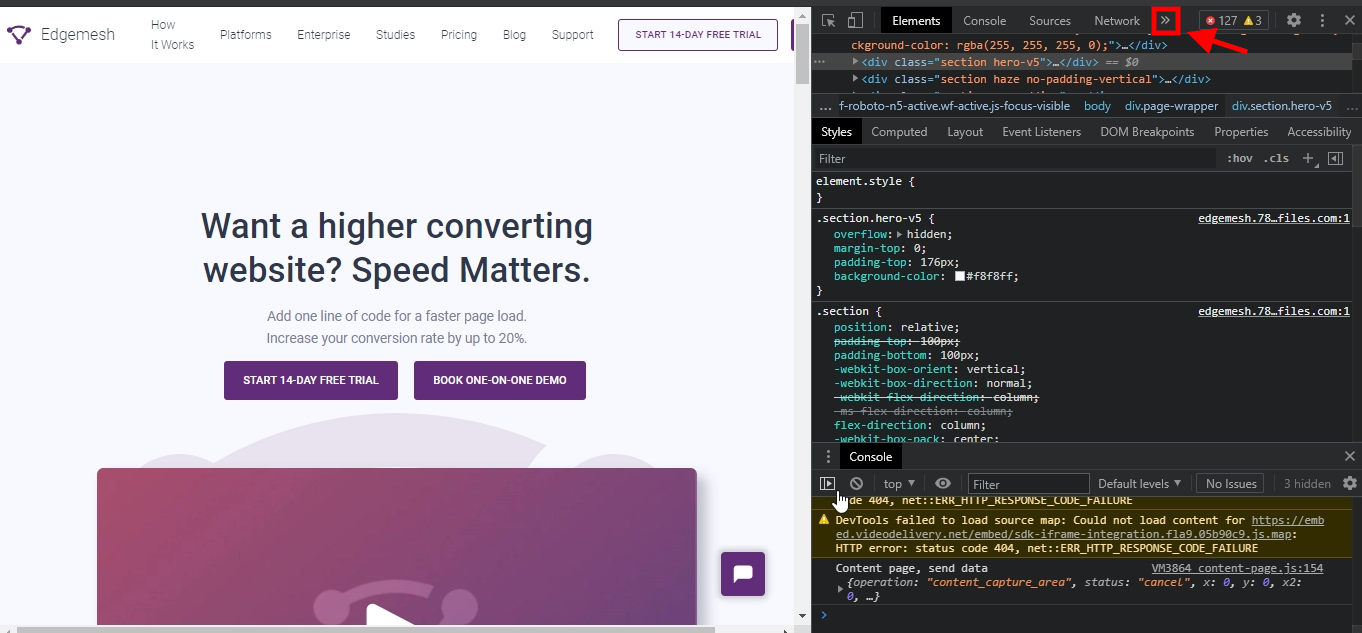
- By clicking that, you’ll get the following options below, on one, performance will be included.
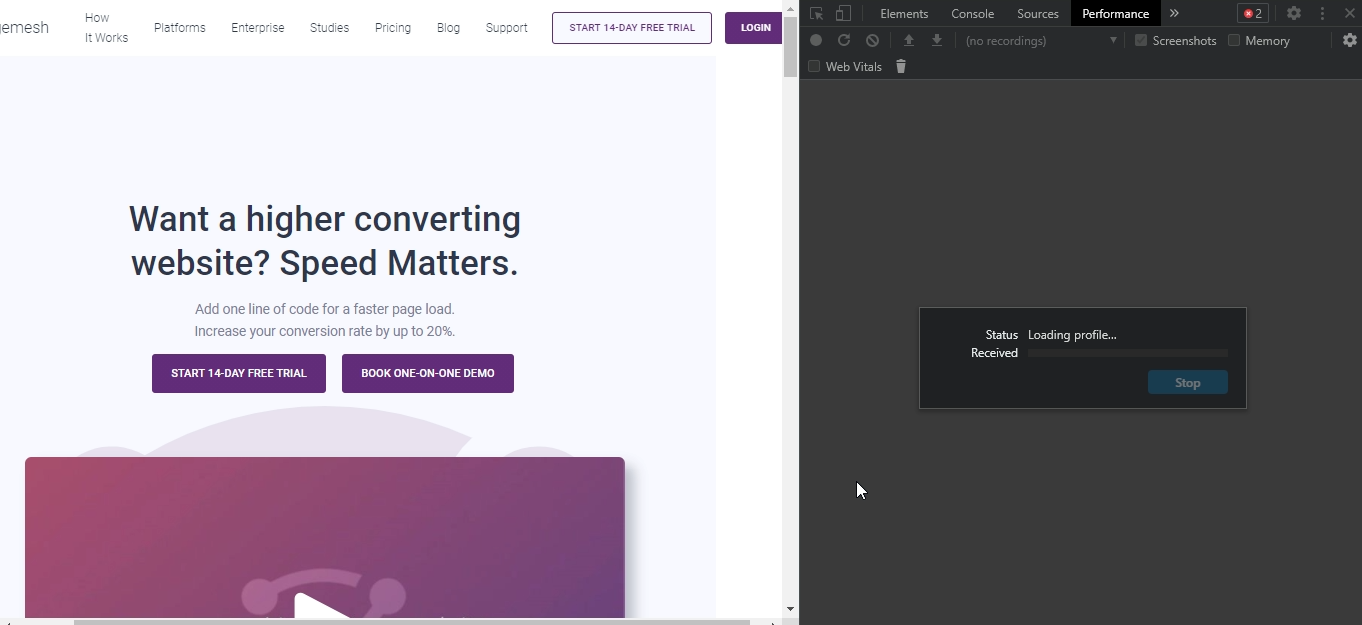
- Click on performance, and when the page loads, reload the page to record the LCP

- When you click the reload option, the tool profiles the website and reloads the entire website so you can get a more accurate result.
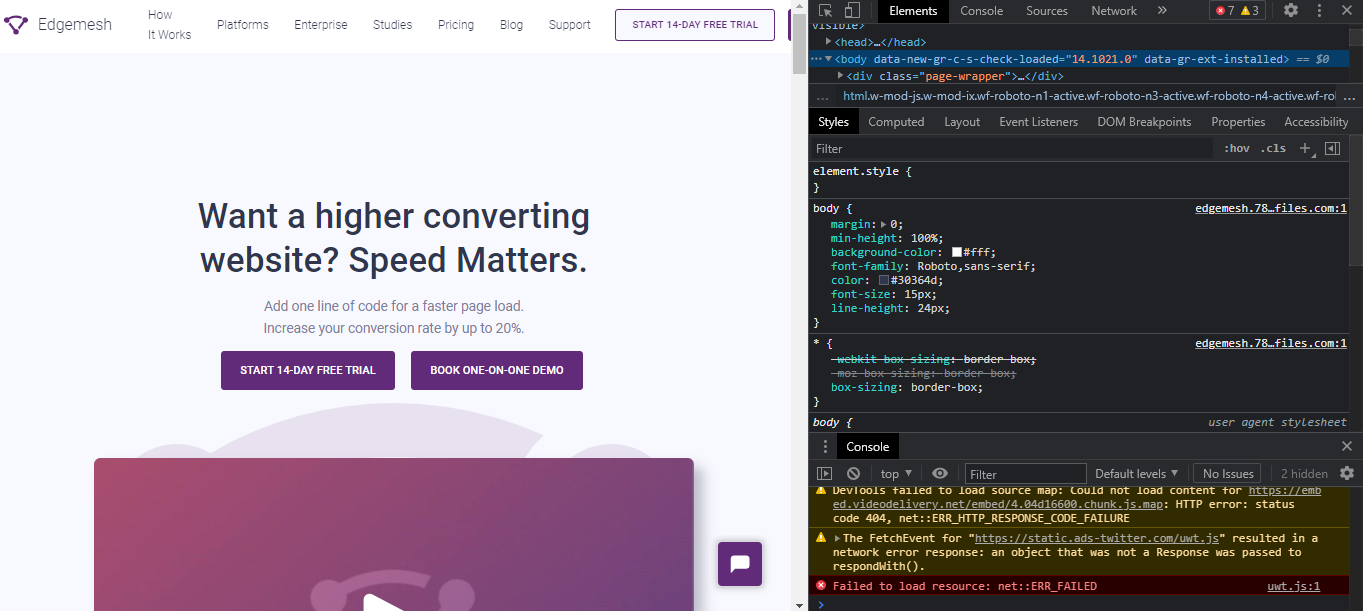
- After the page reloads, you get a whole lot of different metrics under the performance tab. But since we’re looking for LCP, our focus is on “Timings.”

- Click on “Timings” and you’ll get a dropdown of metrics such as FP, FCP, and LCP.
- FP means First Paint.
- FCP means First Contentful Paint.
- By clicking or hovering your mouse on LCP, you can track which contentful element on the website is being measured.
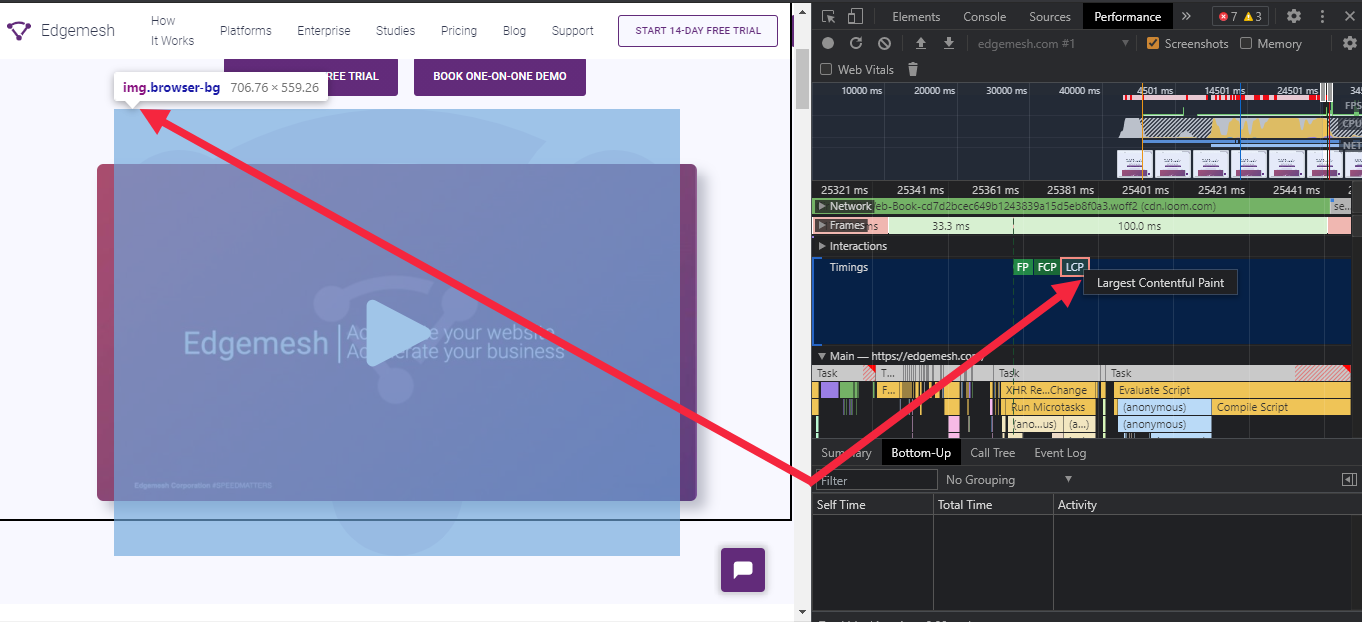
In this case, it’s our video showing you how page speed is vital to the success of your business.
#SpeedMatters
Both of the already explained methods and tools here can be used to help you find and measure your LCP. Depending on the results you get on your LCP, you can either be on the good or bad side.
If you have a good LCP score <=2.5s, then your website is fine.
However, if you have a poor LCP score >=4s, below are some common causes.
Factors Causing Poor LCP Score
Several factors contribute to a website’s function —and some of these impact how content is displayed to the end-user.
Looking at how the website is built, what platform the site is built on, plugins installed, widgets, number of activities present on the website, etc., leaves you with plenty of possibilities for the cause of a poor LCP score.
But all of these issues can be filtered and grouped down into 4 specific causes of Poor LCP scores.
- Slow Server Response Time
- Render-blocking JavaScript and CSS
- Slow Resource Load Time
- Client-side Rendering
1. Slow Server Response Time
Server Response Time (SRT) is the amount of time it takes for a web server to respond to a web visitor's request.
In simpler terms, SRT is the time between when a web visitor makes a request (enters a URL or clicks on a link) and the associated web server to that link responds to that request.
The time between you clicking and the content showing up = SRT
A slow SRT means it takes a long time for the server to respond to a user’s request. This will overall affect your page load time and most definitely your LCP score.
Your LCP score is affected this way when your SRT is slow:
When a user types in your address or clicks on your link, your server upon receiving the request takes over 200ms Time To First Byte (TTFB) to respond to that request.
Side note: The unit known for measuring SRT is TTFB.
Ideally, Google recommends you keep your TTFB under 200ms to avoid having a poor LCP.
Factors causing Slow Server Response Time
- Resource CPU starvation
- Slow database queries
- Slow routing
- Poor back-end structural framework and API responses
- Memory starvation
- Slow application logic
- Libraries
2. Render-blocking JavaScript and CSS
The styles and designs of the content of your website are a mixture of CSS and JavaScript tags. Even though they both help your website look better, they can also affect your LCVP score especially if they are being used heavily.
Here’s how it works:
When a web visitor requests for your page, the browser has to render the response gotten from the server visually for the web visitor.
But before that can happen, the browser has to parse the HTML of the requested page and make it readable into the HTML structure of the page.
If the process above goes through, the content will be displayed and rendered completely.
However, if the external stylesheets (CSS) and script tags (JavaScript) block the parsing of the HTML, there’ll be a delay in the time it takes for content to be fully rendered and displayed.
Due to this, your LCP is delayed and it directly affects your overall score.
3. Slow Resource Load Time
The larger your resources are, the slower they are going to render — fact.
It doesn’t matter how good your hosting service is, if your resource files are heavier than they should be, your LCP score will be affected.
Unoptimized images, oversized animations, excess customization, multiple active plugins, and uncompressed text files result in your resources loading more slowly.
Together, this affects your browser in receiving and rending the responses it gets from your server —hence leading to a poor LCP.
4. Client-side Rendering
Client-side rendering is a common web development method that involves rendering website pages directly in the web browser. This method is quite helpful in improving your page load time as it retains pages rendered earlier for users without them having to send requests back and forth to the server.
However, if not done well, it can affect your LCP score.
Due to how client-side rendering works, JavaScript is needed to render the pages in the user’s browser.
In cases where the JavaScript tags are unmonitored and unoptimized, web visitors are likely to see or interact with any content on the page —until the JavaScript has finished downloading and executing its requests.
Enough about what factors are causing you to have a poor LCP score, here’s how to fix it.
How to Improve your LCP Score
In the previous section, we talked about 4 common causes of poor LCP and how it affects the overall experience of a web visitor.
In this section, you’re going to learn about the solutions to each of those factors affecting your LCP score.
1. Optimize your Time-To-First-Byte (TTFB)
In optimizing your TTFB, you speed up your server response time, which makes your content render and display faster.
To do this, you must first optimize your server. Two questions to consider:
- Do you need to change your hosting service?
If your response and request queries are not excessive and fully optimized but your server response time is still slow, then you need to change your hosting service.
Like we discussed in our website optimization guide, your hosting service should have a guarantee of at least 99.95% server uptime and above. Anything less is dangerous for your website.
How Poor Page Load Time Is Killing Your Business — The Complete Website Optimization Guide
And if your current hosting service is fine, then it takes us to the next question.
- Do you need to upgrade the current one?
In optimizing your server, the type of hosting plan you’re on might not suit the type of website you run.
For instance, let’s say you run a big eCommerce website like Nike. It’s not recommended that you use a shared hosting plan. The possibilities of your page load time, TTFB, and LCP score to be at an all-time high are limitless. It could even crash the whole website.
Instead, you could opt for a dedicated or virtual private server depending on your hosting service.
Meanwhile, the amount of traffic you get and where you get them is an important factor to consider.
For the most part, if you’re receiving a large amount of traffic, say 100k visitors monthly, a dedicated hosting server is your go-to to optimize your server for a good TTFB and good LCP score.
Now, depending on where a large percentage of your traffic comes from, using a CDN and caching your assets will give you a good boost.
- Using a CDN
CDN stands for Content Delivery Network and it helps you reduce the time it takes for the server to respond when a user makes a request. CDN is mostly used for websites whose traffic is far from the location of the server.
In cases where there’s no CDN, web visitors trying to access your website will experience a high latency which makes all your resources assets be sent and displayed late.
With CDN, there’s an interconnected global network of servers that allows your web visitors to receive a copy of your website through the closest server to them.
This drastically reduces your LCP score and overall page load time.
- Caching your assets
Having your assets unnecessarily reloaded every time a web visitor comes back to your website can be a major drawback for your LCP score —and caching solves this.
When you cache your assets, (either on the client-side or server-side) you’re letting the server or the browser retain a copy of a requested page by a web visitor for later purposes.
Depending on how your website runs and the content displayed on it, you can choose to cache in two ways:
- Full-Page Caching: This caching technique means you’re letting the browser or server keep a copy of the entire page readily available for your web visitors.
- Object Caching: Sometimes also referred to as fragment caching, this technique allows the browser or server to keep only specific objects or resources on the requested page. This technique is most common when you have heavy assets on the requested page.
2. Remove Blocking Assets in JavaScript and CSS
The HTML parse blockage caused by JavaScript and CSS is the primary cause of the poor LCP scores. For you to avoid this, you have to:
- Defer your JavaScript Files
- Defer non-critical CSS
- Defer your JavaScript Files
Deferring JavaScript files is all about changing the priority and type of files being loaded when a user requests a web page — and in turn, improving your LCP score.
With this, when the browser parses the HTML to build a DOM tree and render the page —then only after that will the browser process and load the JS files.
To enable deferring your JS files, you can go to the back-end of your website and add a defer attribute.
Below is a quick example:
<script defer src="/example-js-script"></script>
With this, the browsers will read the HTML and build a DOM tree without any interruptions.
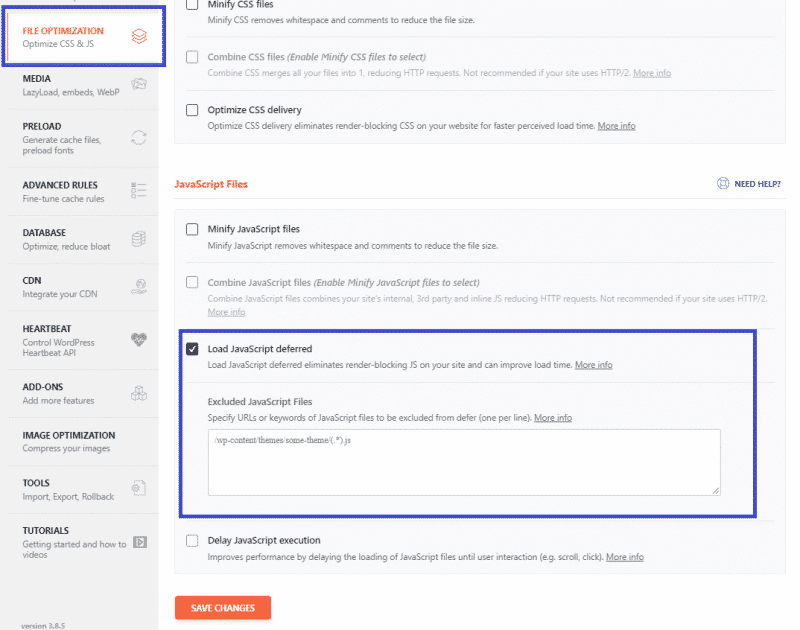
On the other hand, if your website is built on WordPress, you can use a plugin like WP-Rocket to help defer your JS files.
- Defer Non-critical CSS and Inline Critical CSS
Not all designs on your website are necessary to make it function. And just as you did for your JS files, the same goes for your CSS.
Files not important to the rendering of the page need to be deferred in the best way possible. To find files not used for rendering, you can use your ChromeDevTools as we did earlier.
Here’s a quick example from Google:

Deferring your CSS files is one part of the puzzle, the other part is for you to inline critical CSS directly inside the HTML structure.
Particularly in the <head>
What this means is for your browser to quickly load and render your resources that are above the fold.
This is because the largest contentful paint metric is mostly concerned with your resources that render above the fold.
Here’s how we did ours at Edgemesh:
- The opening of the HTML structure <head>
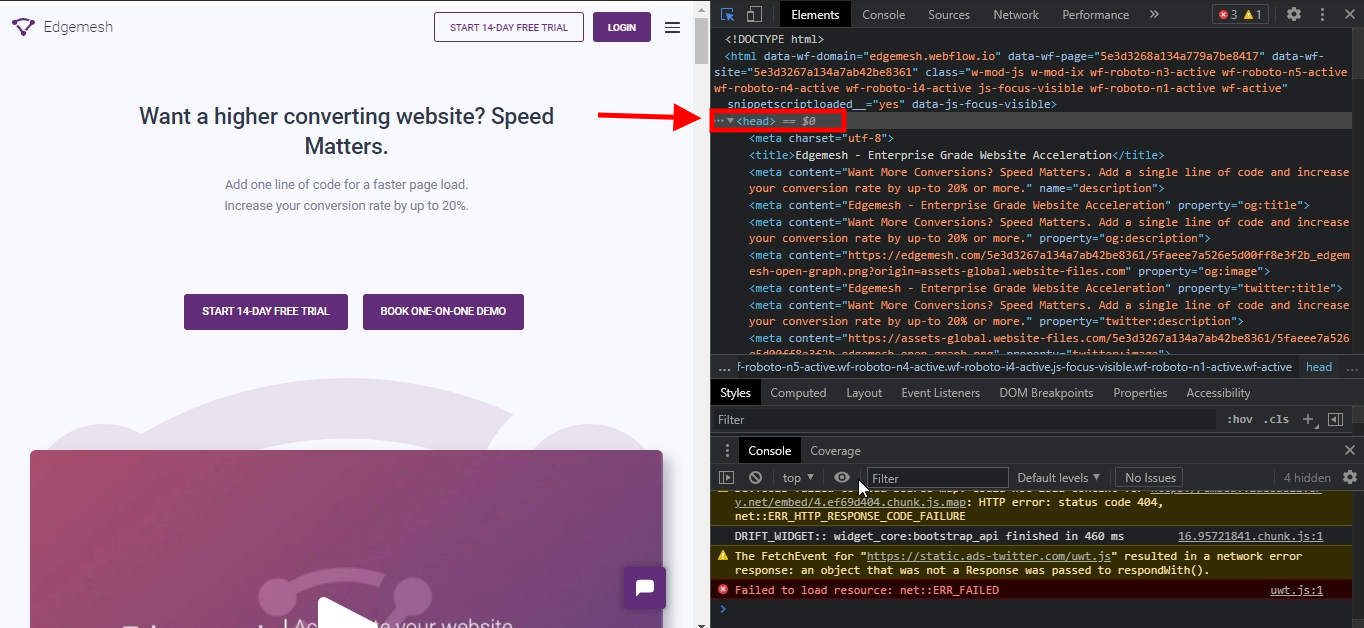
- Critical CSS inline directly inside the HTML structure for important styles above the fold </head>
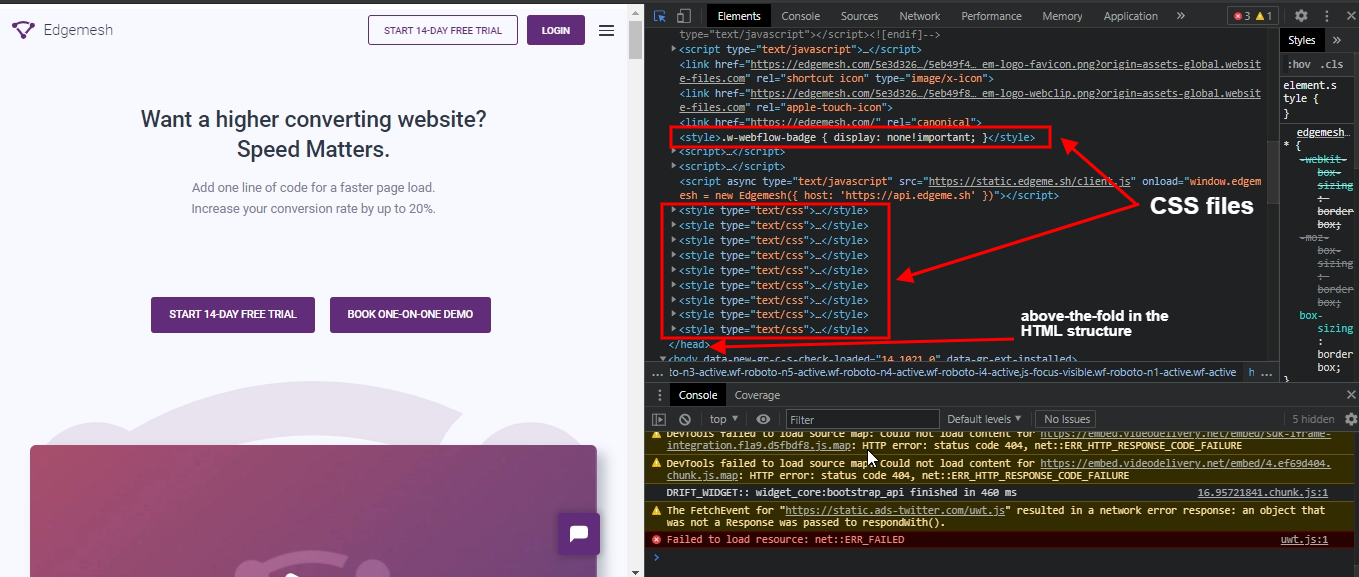
The reason is to minimize blocking time which then reduces the Round-Trip Time (RTT) of resources to fetch requests back from the server and render for the web visitor.
3. Optimize Your Visual Content
Various resources on your website —visual content i.e., images, videos, text files, animations, and graphics, take up a good amount of front and back requests from the server to fully load and render in its default format and size.
Typically, optimizing your images is a great starting point to fixing a bad LP score.
- Optimizing your Images
A large percentage of visual content is images, and most have different weights and sizes depending on their quality. Normally, the smaller the size of images present on a website is, the faster it’ll load.
To get a faster loading time and LCP score, you have to optimize your images. A few ways to do that:
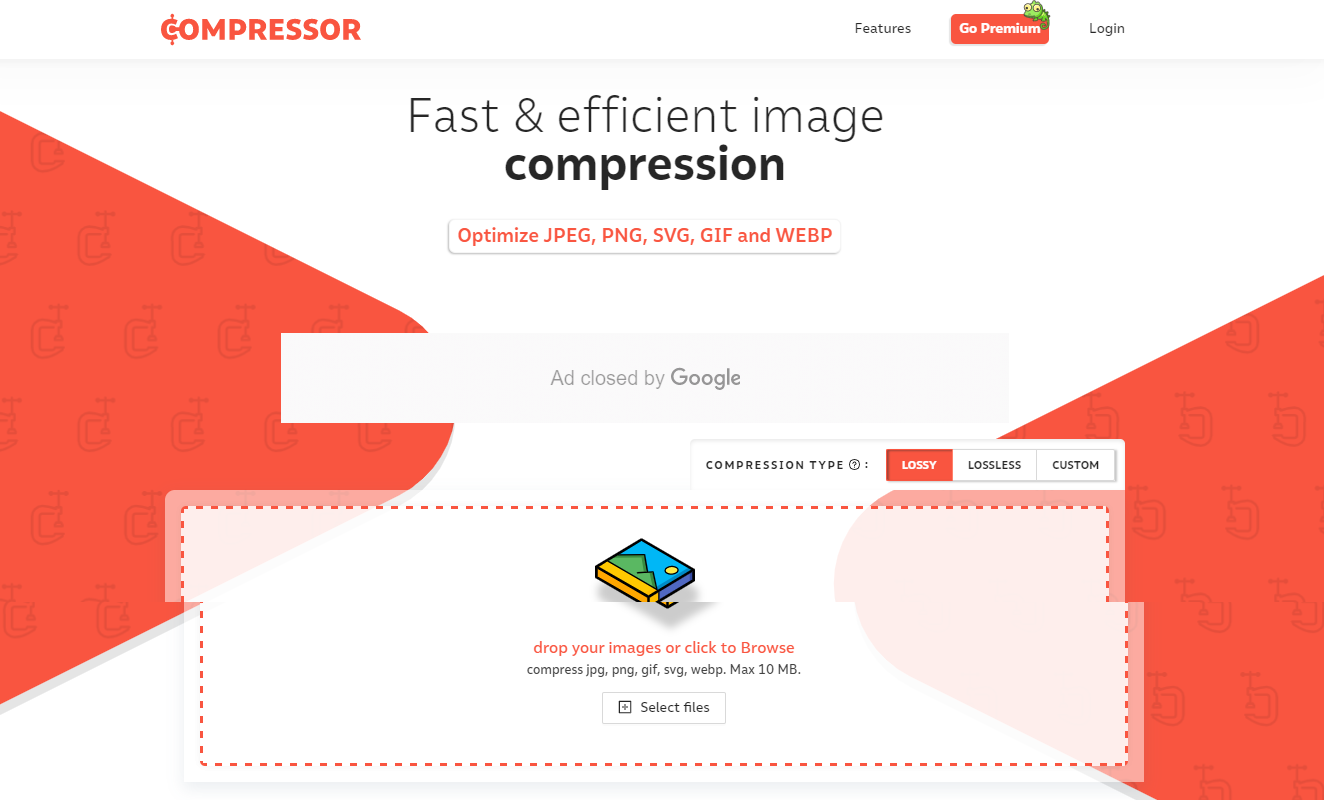
Compress your images
For a lot of websites, compressing and reducing the quality of their images will affect their overall user experience —so it’s a no-go area for them. Meanwhile, there are tools to reduce image size without sacrificing quality.
Compressor.io is a great example of a tool that does this perfectly without losing image quality.
Just upload your files (max limit is 10Mb) and the tool will compress your images to the best size possible without any quality reduction.
Convert into new formats
The default JPEG, PNG, and GIF image formats can be heavy in terms of size. A better way to optimize for that: convert into a smaller version of the same format, for example, JPEG XR and JPEG 2000. Google recommends converting your images into WebP format as they’ll load faster regardless of size.
Other ways you can also look into are:
- Encoding images
- Cache heavy images
- Avoid sliders (use static images instead)
- Remove lazy loading feature from the LCP
- Prioritize responsive images
4. Make Use of Server-side Rendering and Pre-Rendering
By now, you’ve noticed the primary aim of LCP is the rendering speed of a web page. The two techniques you can use to improve your LCP are Server-side and Rendering and Pre-Rendering.
Server-side Rendering
This technique aims to reduce the amount of JavaScript needed for the website to render completely. The best way to use this technique is to combine it with client-side rendering.
By combining both, you’re ensuring the primary content of the page is rendered on the server and the client.
Pre-rendering
The pre-rendering technique is a different type of rendering and is less complex. It uses a method that makes browsers without a user interface generate static HTML files of every route during its build time.
In most cases, these files are tagged along with the JS tags needed for such a browser application.
5. Use a Service Worker (Bonus)
Service workers take care of the majority of the problems you’d likely encounter with poor page load time and LCP score. With a service worker, you can easily cache any of your resources that are static on the back-end. This way, you can avoid unnecessary repeat requests.
They even simplify handling requests from web users and responses from web servers by serving smaller HTML responses to the end-user.
Edgemesh is a great example of a service worker for medium to large enterprises who want to speed up their websites.
Conclusion
Largest Contentful Paint’s primary goal in web performance is putting your web visitors first and ensuring a top-notch experience.
A good LCP score tells Google that users can easily navigate your website — and that impacts your conversion rates.
Talking about LCP, what’s your score and what have you done in the past to improve it?
If customer experience, good conversions, low bounce rates, and overall — speed — matter to you, you’ll love Edgemesh’s Enterprise-Grade Web Acceleration.
With our intelligent, automated, and next-generation client-side caching, your website is ready to move at a full speed — with just a single line of code.
Plus, it takes less than 5 minutes to set up, so what do you say?
Start your 14-day trial and learn what speed can do for your business.


