

Have you ever found yourself on a website that feels like it has finished loading, but when you click on any of the elements, it’s unresponsive for a while? Your first thought might be that the website is broken or perhaps it’s your network connection.
If neither is the cause, what you just experienced is called a “Total Blocking Time.”
In one of Google’s recent updates, the Lighthouse V6, they introduced the Total Blocking Time as a replacement to the First CPU idle to help serve as a metric to measure a website’s responsiveness to user’s input during page load.
In this article, we cover all you need to know about total blocking time, how to measure it, and how to improve it.
What is Total Blocking Time (TBT)?
Total Blocking Time (TBT) measures the total amount of time between First Contentful Paint (FCP) and Time to Interactive (TTI) where the main thread was blocked for long enough to prevent input responsiveness. In short, TBT measures a web page’s unresponsiveness to user input during loading and accounts for 30% of your website’s total performance, according to Lighthouse v.8.

When a user requests a website, the browser uses the main thread to parse HTML, construct the DOM, execute each element’s style with CSS, Javascript, and other essential tasks that make the page render in the user’s viewport.
At any point, if a long task occurs, the main thread becomes blocked. When this happens, the browser can’t stop or interrupt the task, and there will be no response to user input until it’s complete.
This measurement is done by finding the sum of all long tasks between the First Contentful Paint (FCP) and Time to Interactive (TTI).
What Is a Long Task?
A long task is defined as all tasks on the browser’s main thread that exceeds 50ms. This is caused by Javascript files that failed to fully execute within the 50ms time frame—hence, stopping the responsiveness of your website’s element to the user’s input.
A quick example is this browser’s main thread of a loading event.
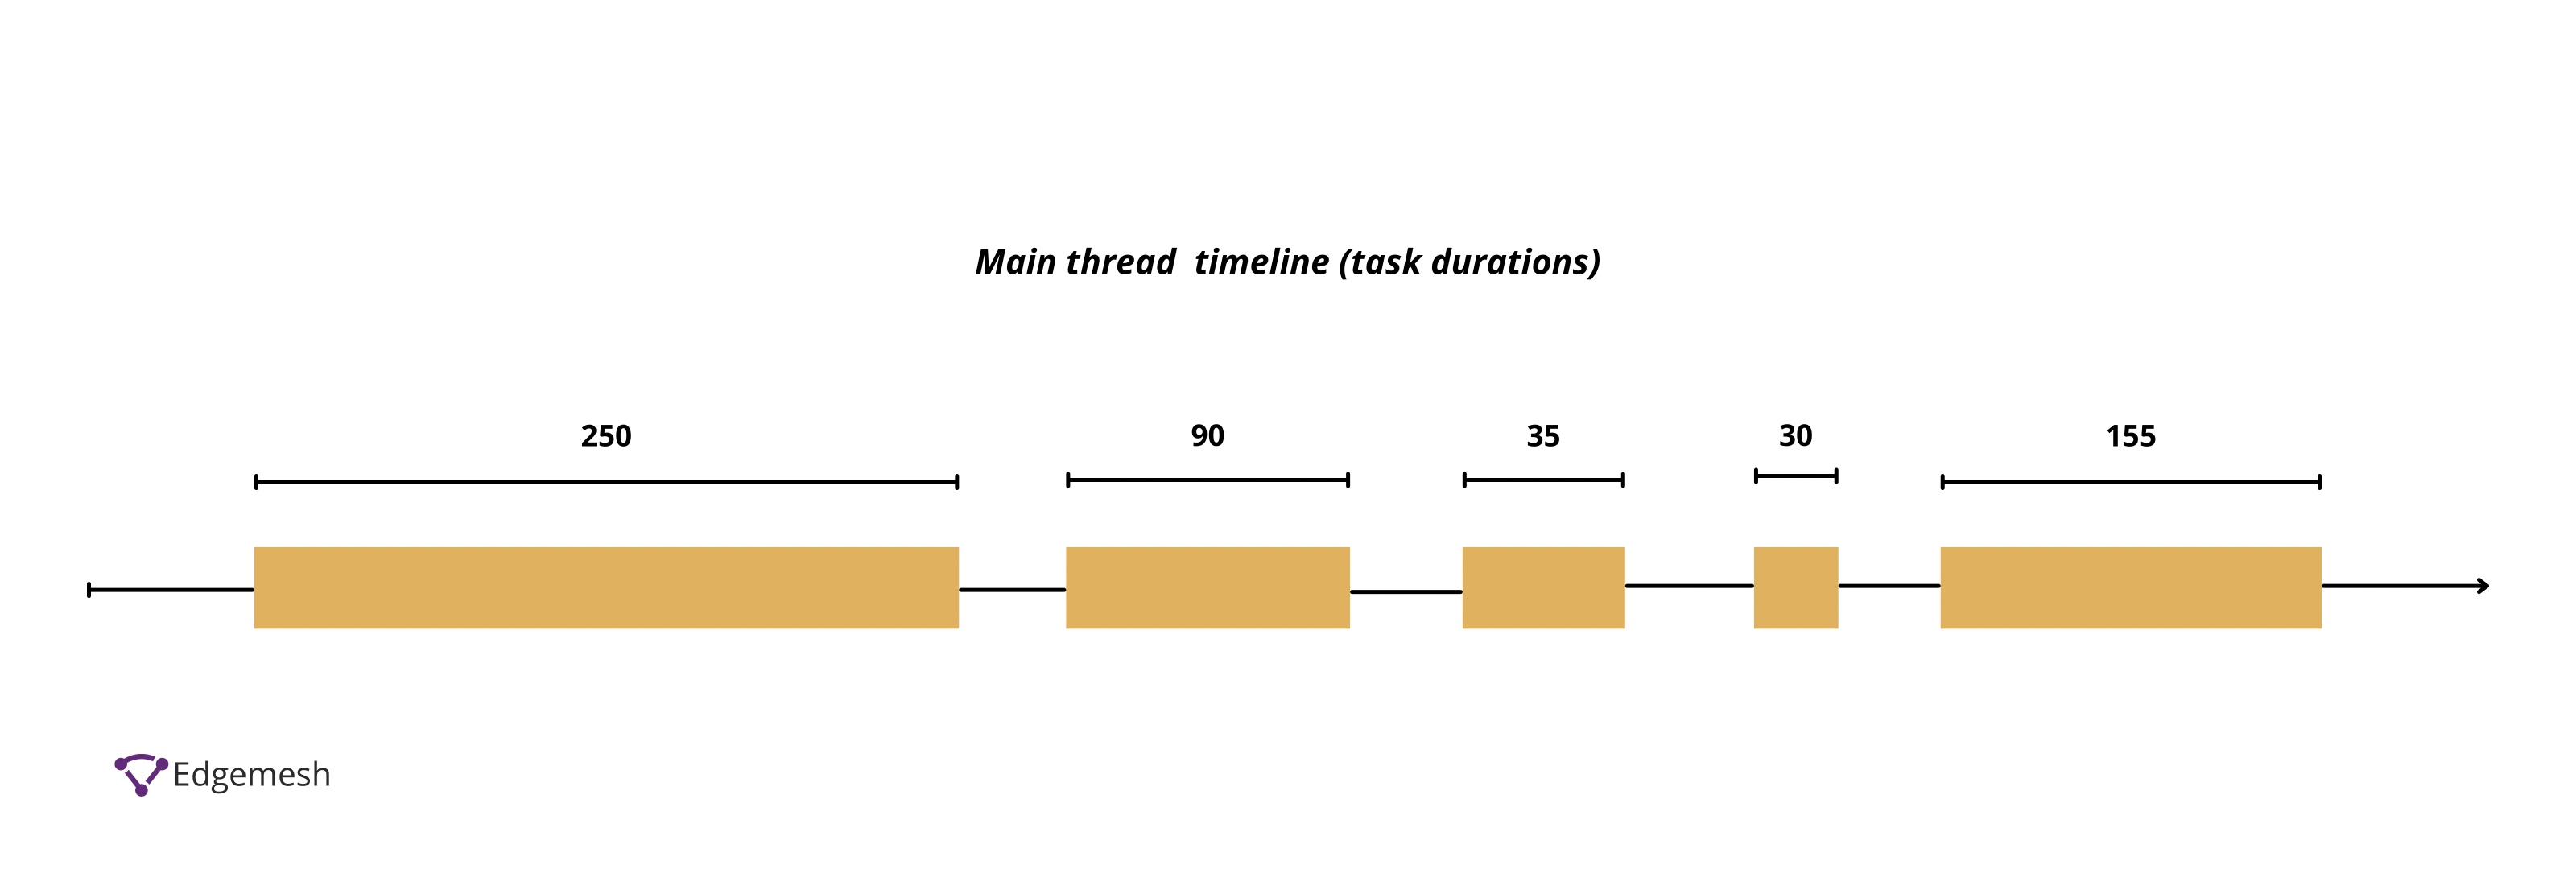
In the loading event above, there are five tasks (task 1-5), of which three (task 1,2, and 5) are long tasks because they exceed 50ms.
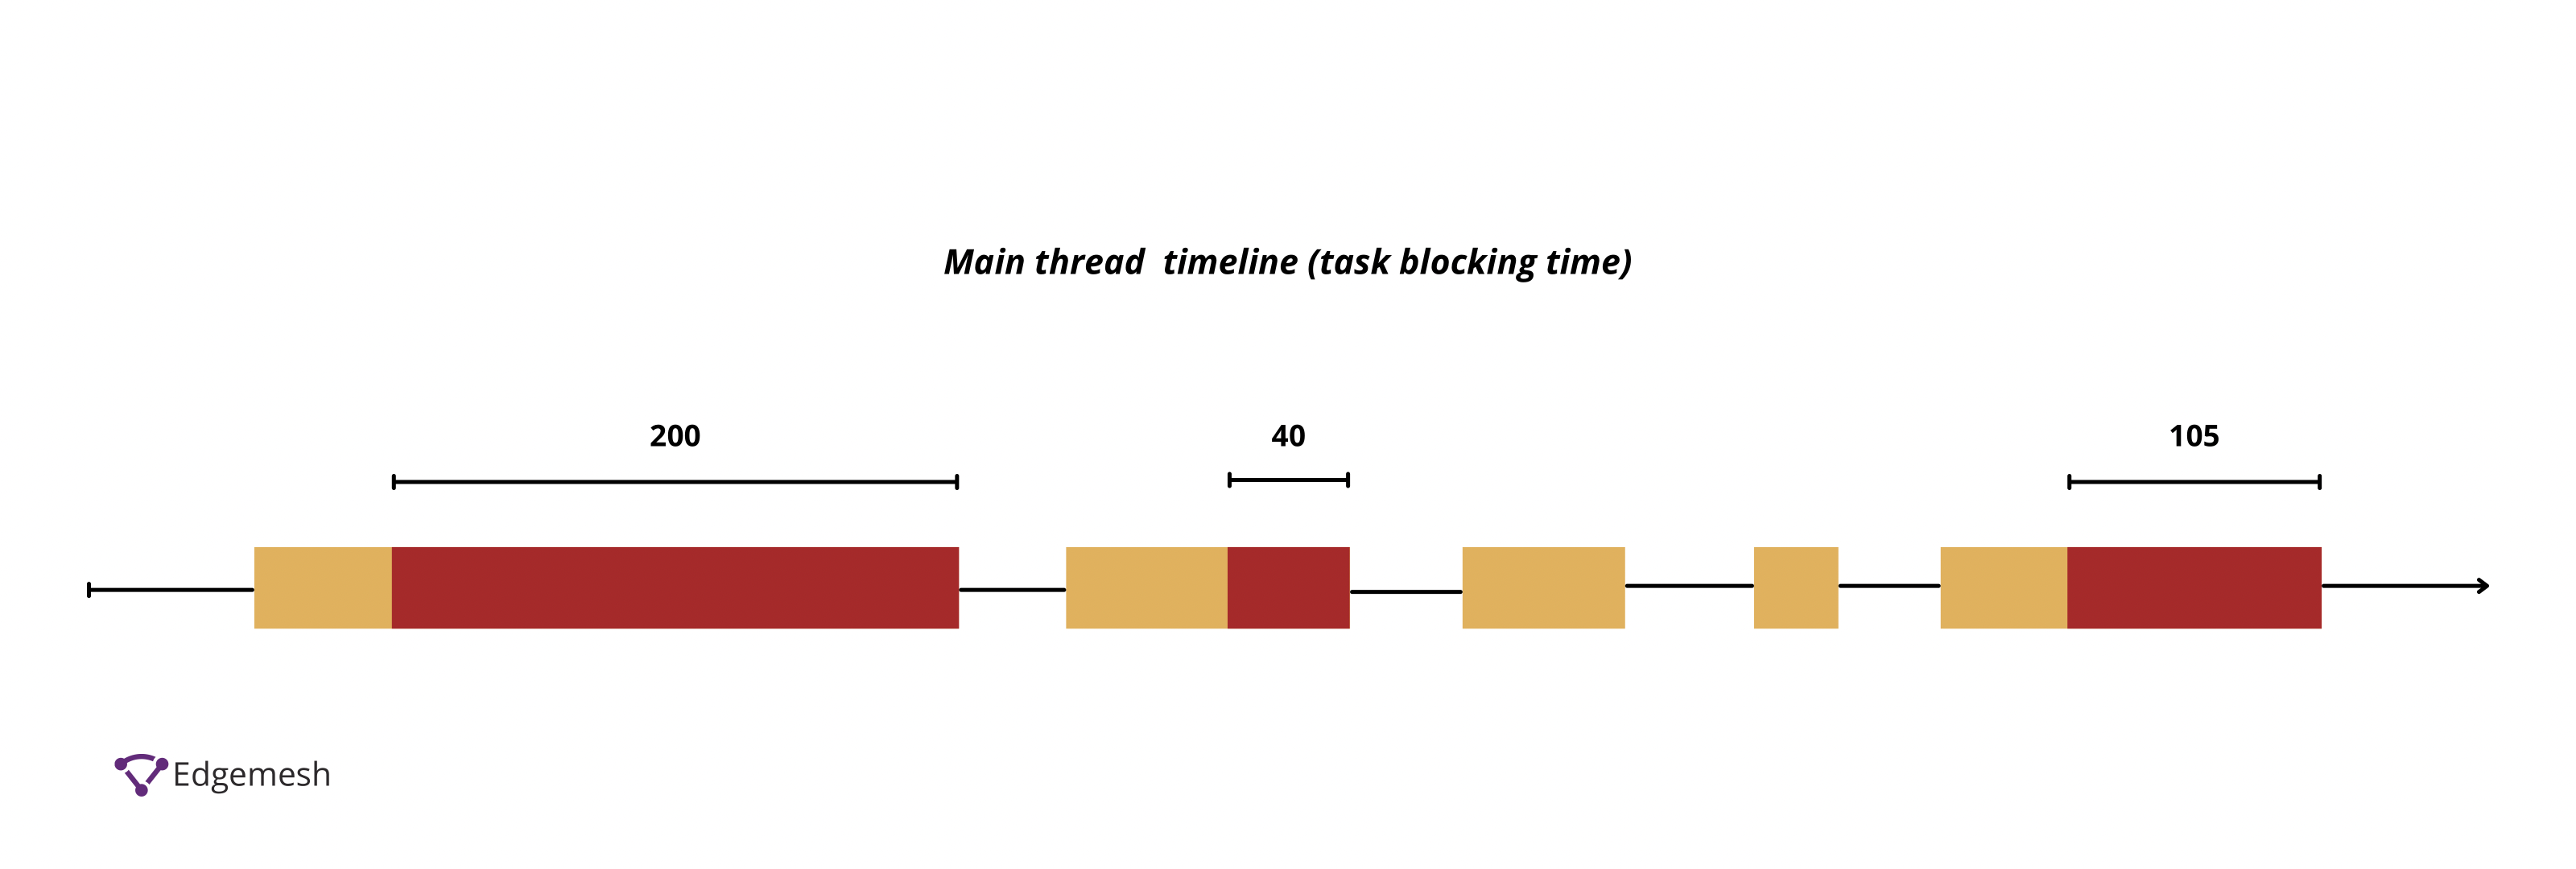

Each of the tasks on the main thread above 50ms is where the calculation of the long tasks starts. Thus, the total of this event load time is 560ms— and 345ms of that time is the total blocking time.
A large part of your website’s functionality and interactivity (taps, clicks, and drags) is driven by event handlers executed through Javascript. If an element renders in a user’s viewport during the loading process of your website but is not yet attached to their respective event handlers, the elements won’t work.
A practical example is when you’re browsing a website, and the button element renders in your viewport, but when you click it, it doesn’t respond—because the code that makes it function is not yet attached. Anything causing these event handlers not to carry out their tasks within the 50 ms triggers the long task.
Why Is 50ms the Base Mark for Total Blocking Time?
50ms is the base mark for TBT due to Google’s reliance on the RAIL model for a good user experience when browsing the web. RAIL stands for Response Animation Idle Load—and its user-centric performance model provides a structure for thinking about web performance.
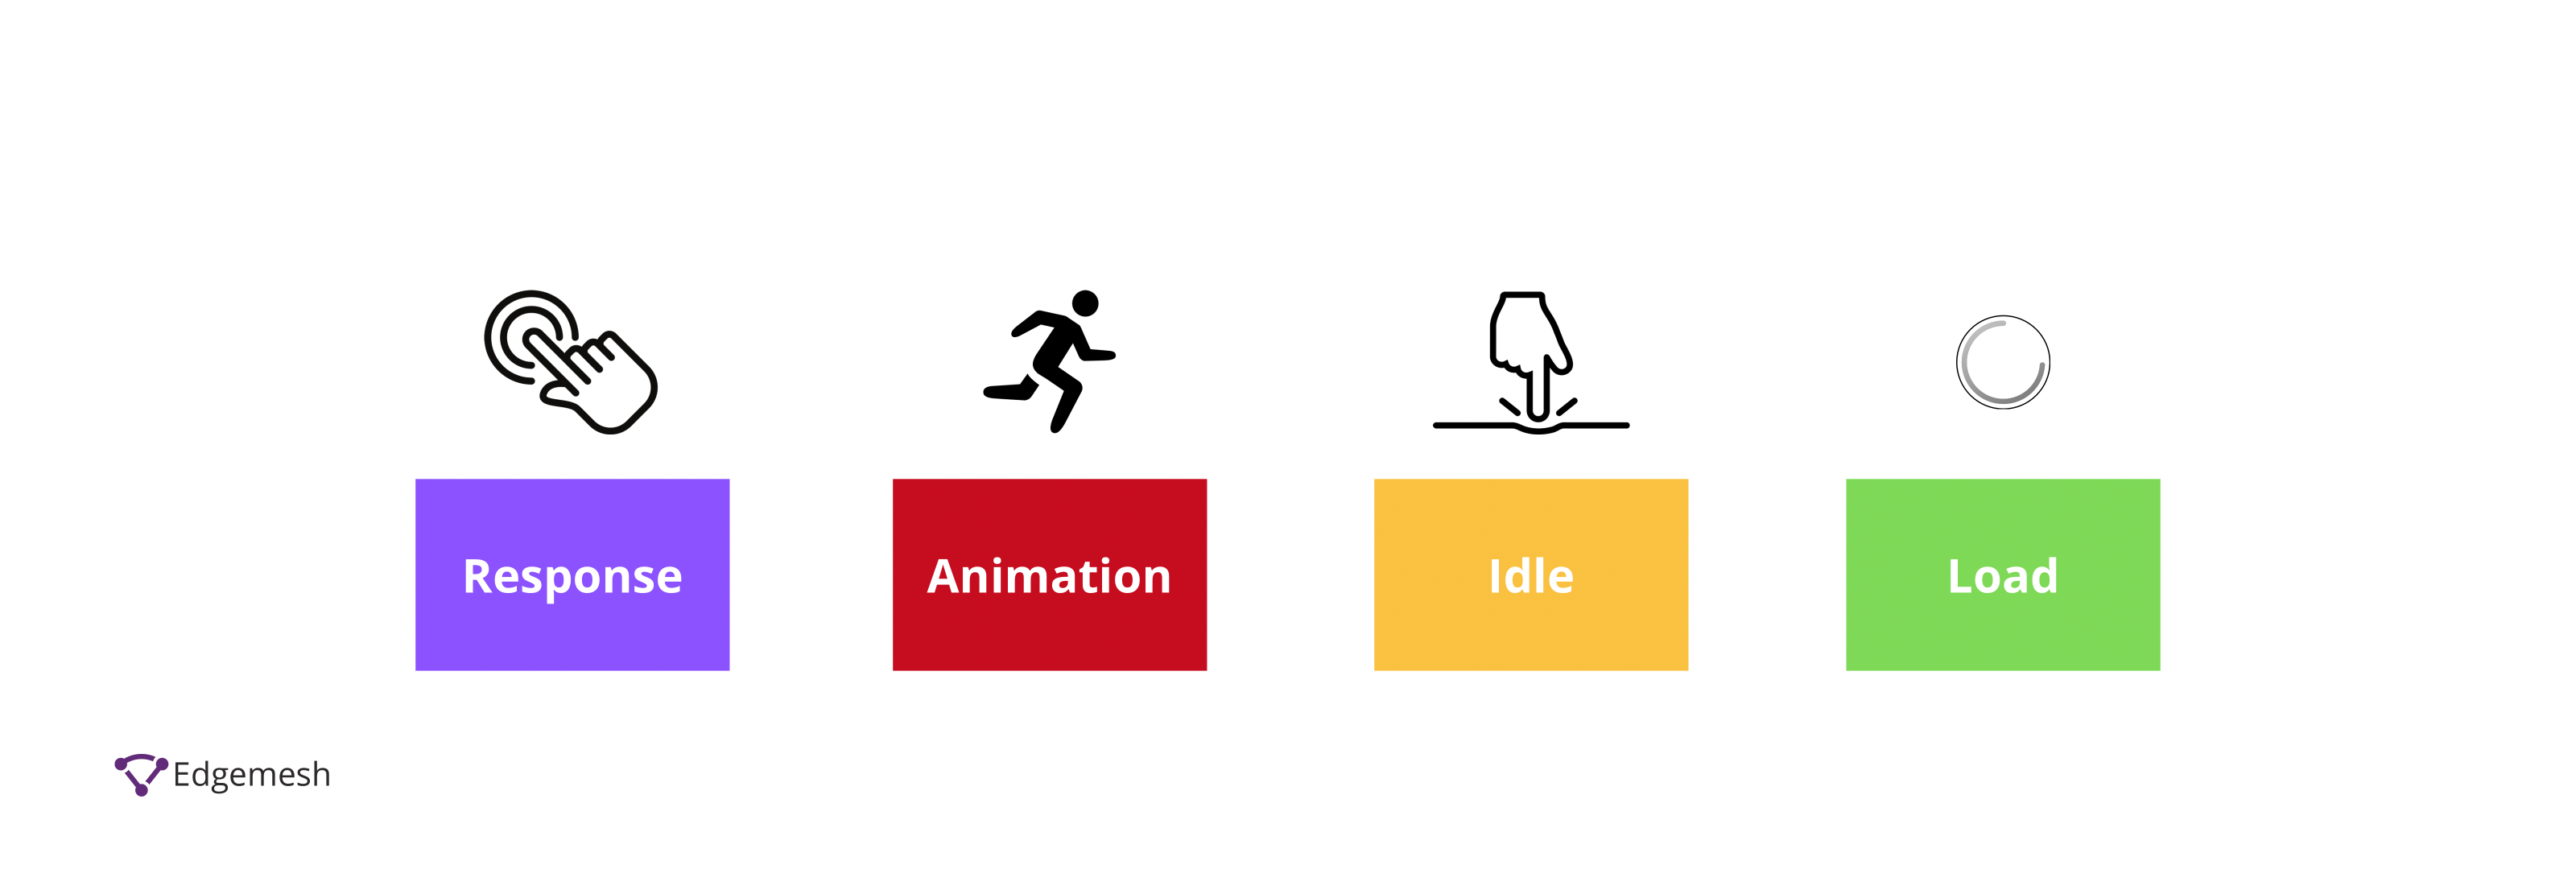
The primary goal of RAIL is to make users the focal point of all web performance. This model further breaks down the user-perceived performance based on the time difference between requests and responses.
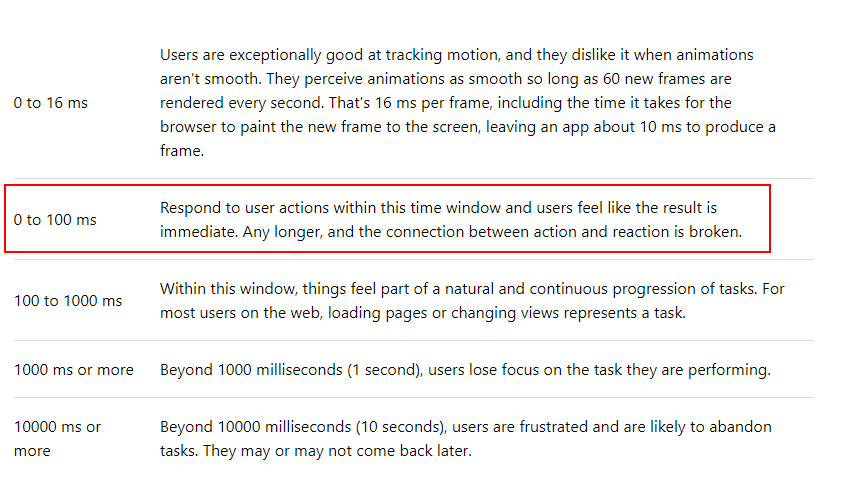
50ms response time to users feels instantaneous compared to anything longer.
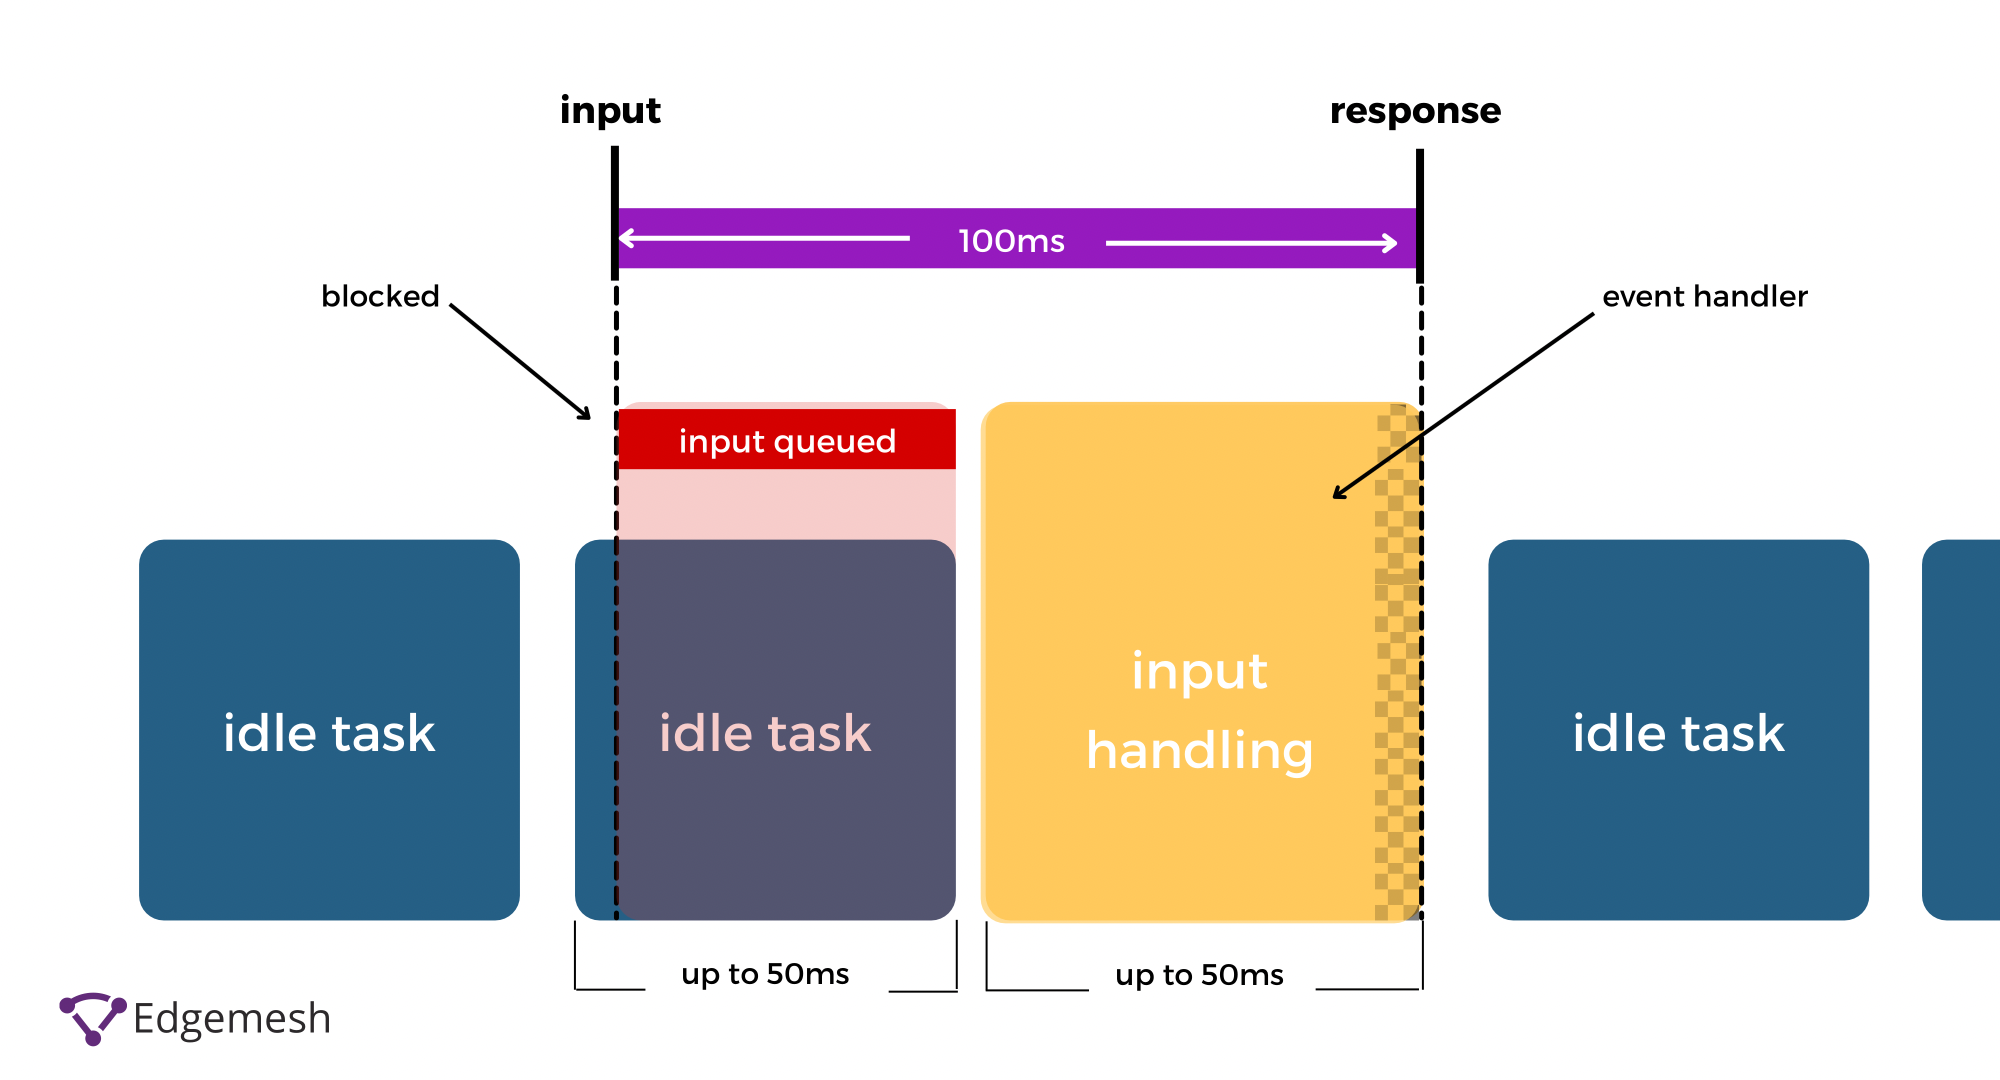
Depending on the number of tasks, the RAIL model assumes that if an application is performing work in the recommended 50ms, you must consider an additional potential 50ms that the previous tasks could have occupied—leaving only 50ms for the browser to respond to the user’s input.
What is the Relationship Between Total Blocking Time (TBT) and Time to Interactive (TTI)?
Many mistake TBT for TTI as they’re closely related in measuring web interactivity. But even though they do almost the same thing, they’re still quite different.
Time to Interactive (TTI) is the time it takes a web page to be fully interactive for a user. For any web page to be considered interactive, it means:
- The page displays useful content, i.e., the First Contentful Paint (FCP)
- Event handlers are registered for most visible page elements
- The page responds to user interactions within 50ms
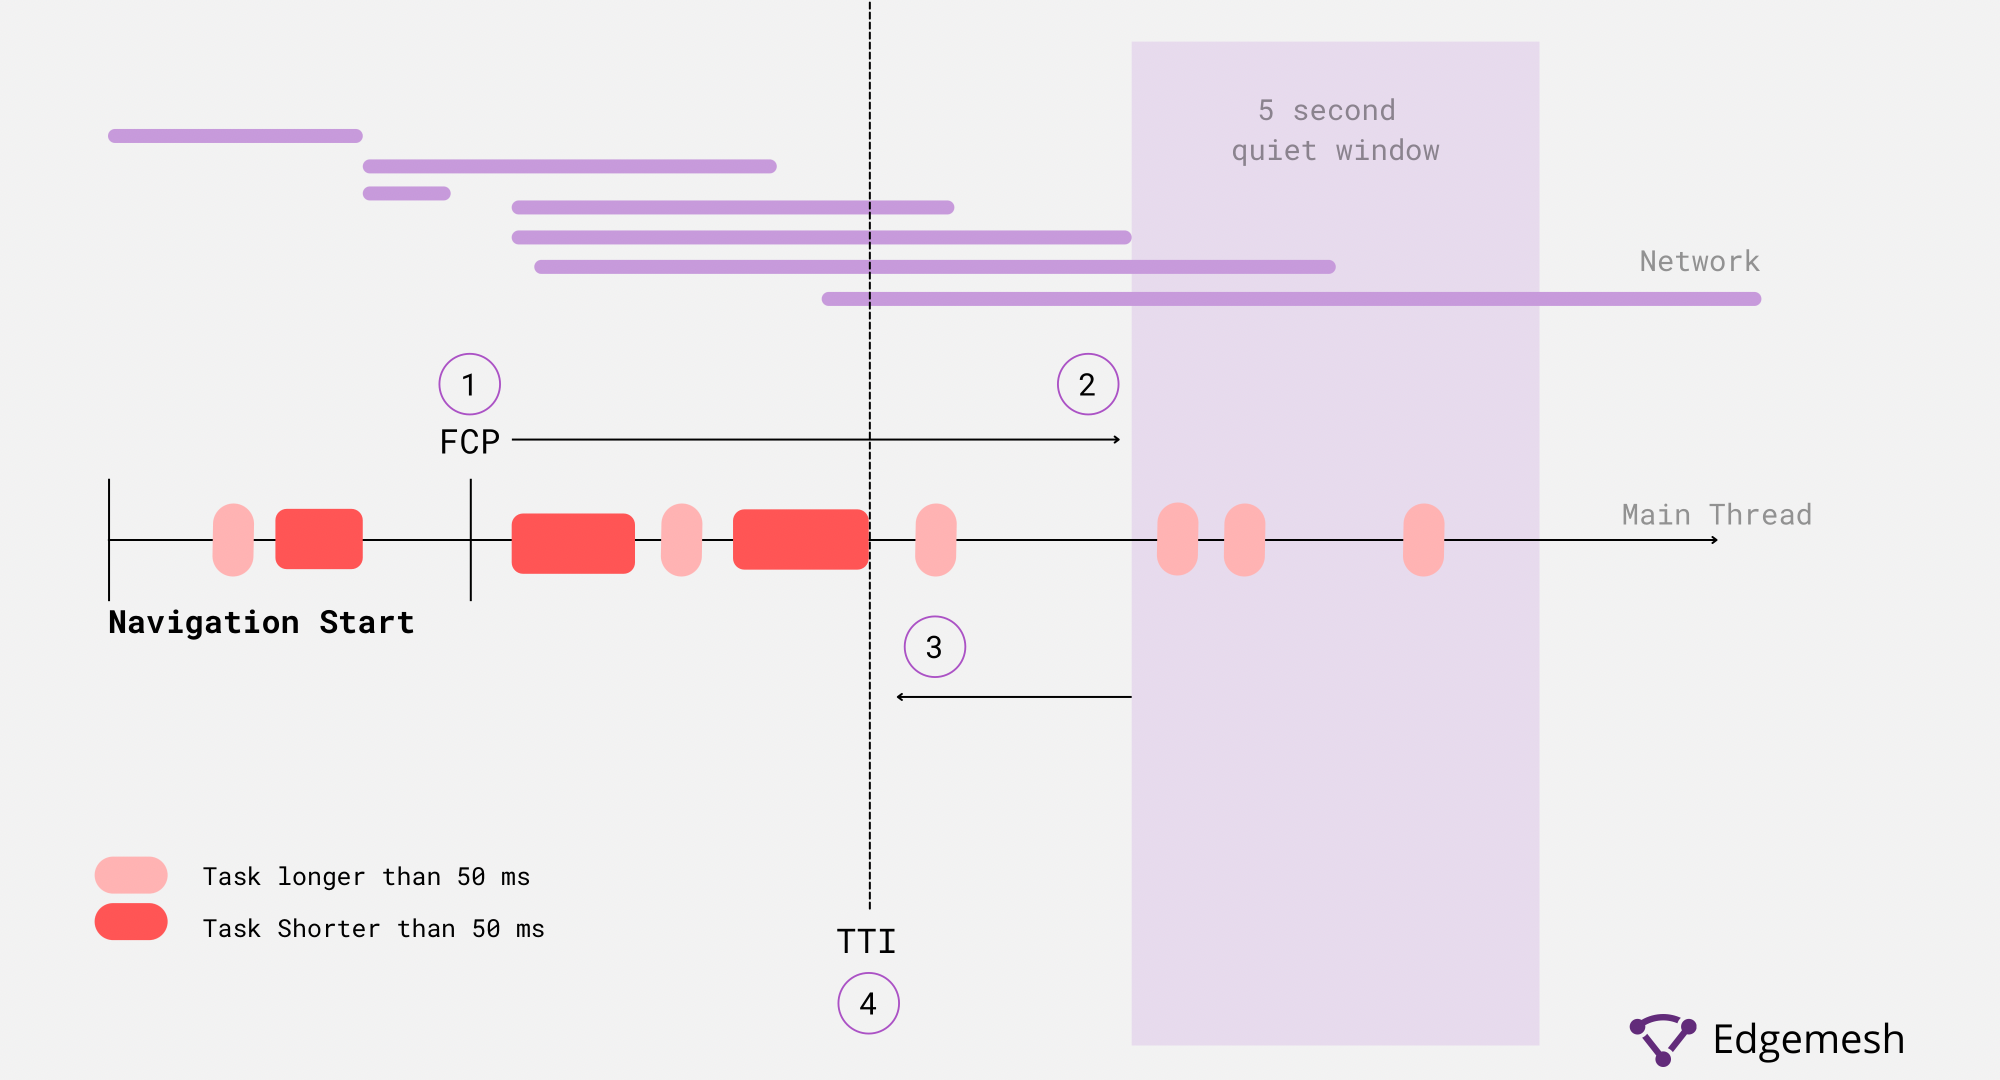
When a web page is still loading, and a user tries to interact with the page, there are delays because the main thread is busy parsing and rendering elements. Each of these delays means the website’s interactivity was affected— this is where TBT comes to measure the impact of those delays to the user experience.
What is a Good Total Blocking Time?
- A good total blocking time is anything below 300ms
- If it falls within 300 to 600ms, there’s a need to improve
- A bad total blocking time is 600ms, and if your website is in this situation, immediately address it
How to Measure Your Total Blocking Time
The best way to measure your Total Blocking Time is by identifying the long tasks occurring on the main thread. The sum of all of these tasks is what makes up your TBT. There are two ways of measuring your TBT — either with Lab or Field Tools. Depending on the tool you use to measure your TBT, you’ll get almost similar results, but each tool operates differently.
- With Lab Tools, you get the TBT score of the web page as it occurs during load time.
Examples of Lab Tools include:
- WebPage Test
- ChromeDev Tools
- Lighthouse
- With Field Tools, the results are based on real user experiences while on the page—hence, “field.”
Examples of Field Tools include:
- PageSpeed Insights
- Chrome User Experience Report ‘
- Search Console (Core Web Vitals Report)
In this article, we’ll use ChromeDev Tools to measure our total blocking time.
Using ChromeDev Tools to Find Your Total Blocking Time
The Chrome Dev Tools comes as an inbuilt section in your Google chrome browser. Apart from being a regular browser, Google has modified the browser to do more than just connecting you to your favorite websites. Instead, you can use a particular section to monitor your website.
- Open your chrome browser on your desktop and go to the web address to measure your TBT and access the performance tab.
- If you’re using Windows, use these combinations—CTRL + SHIFT + I
- If you’re on a Mac, use these combinations—CMD + OPT + I
You should have something like this if you did it correctly 👇
- Another easier way to access the performance tab in chrome is by right-clicking on the web page you want to track—then scroll down and click “Inspect.”
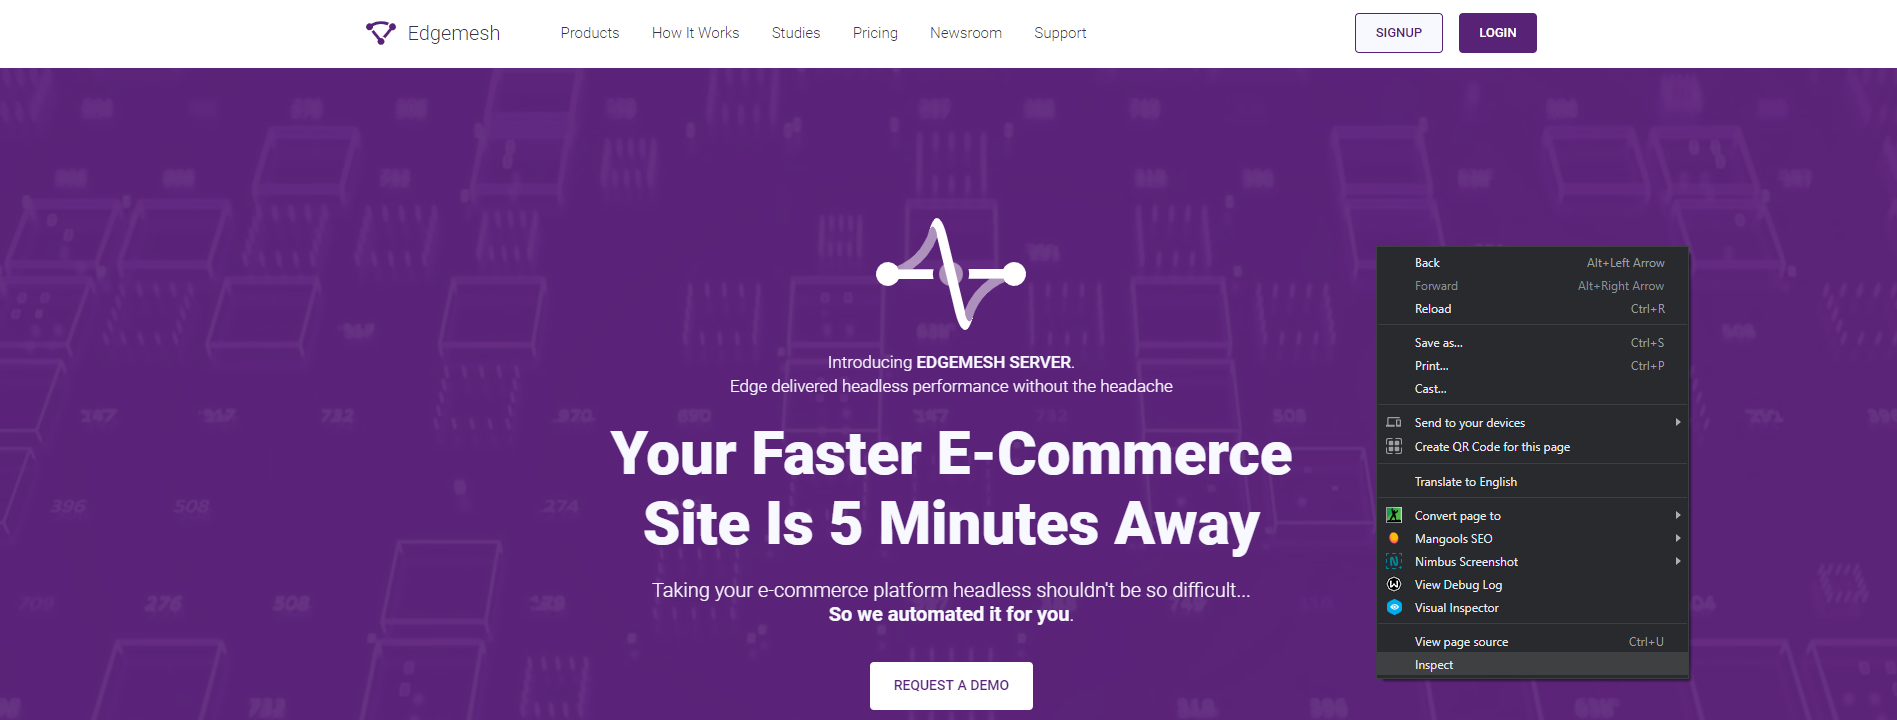
- After opening this on your chrome browser, go to the Performance section at the top of the tab.
- If you don’t see the performance section immediately after opening this tab, click on the “>>” icon, and you’ll see it in the drop-down.
- When you click on Performance, you’ll see two options; you can either choose to:
- Record your current page to get the analysis of its present performance at that point. You can do this by clicking the record button or hit Ctrl + E.
Or - Reload the current page to get a new analysis based on new load events and an entirely new process. You can do this by clicking the record button or hit Ctrl + Shift + E.
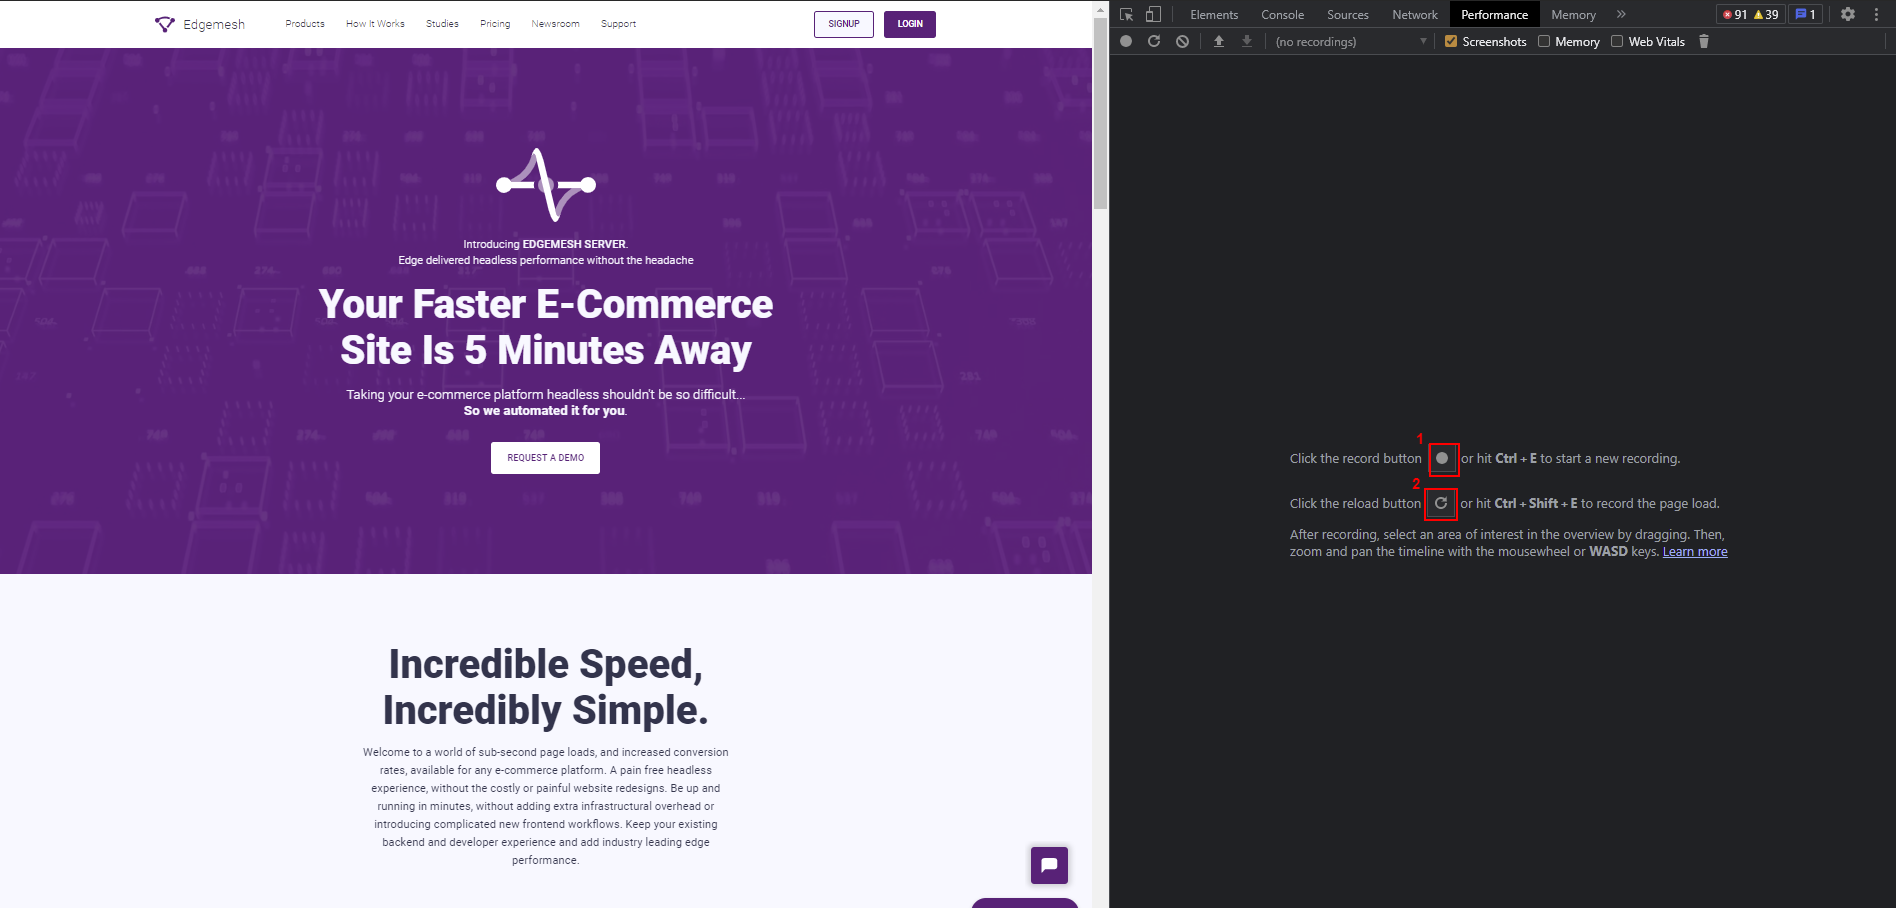
- Reloading the entire website is the best way to measure your TBT and any other performance metric.
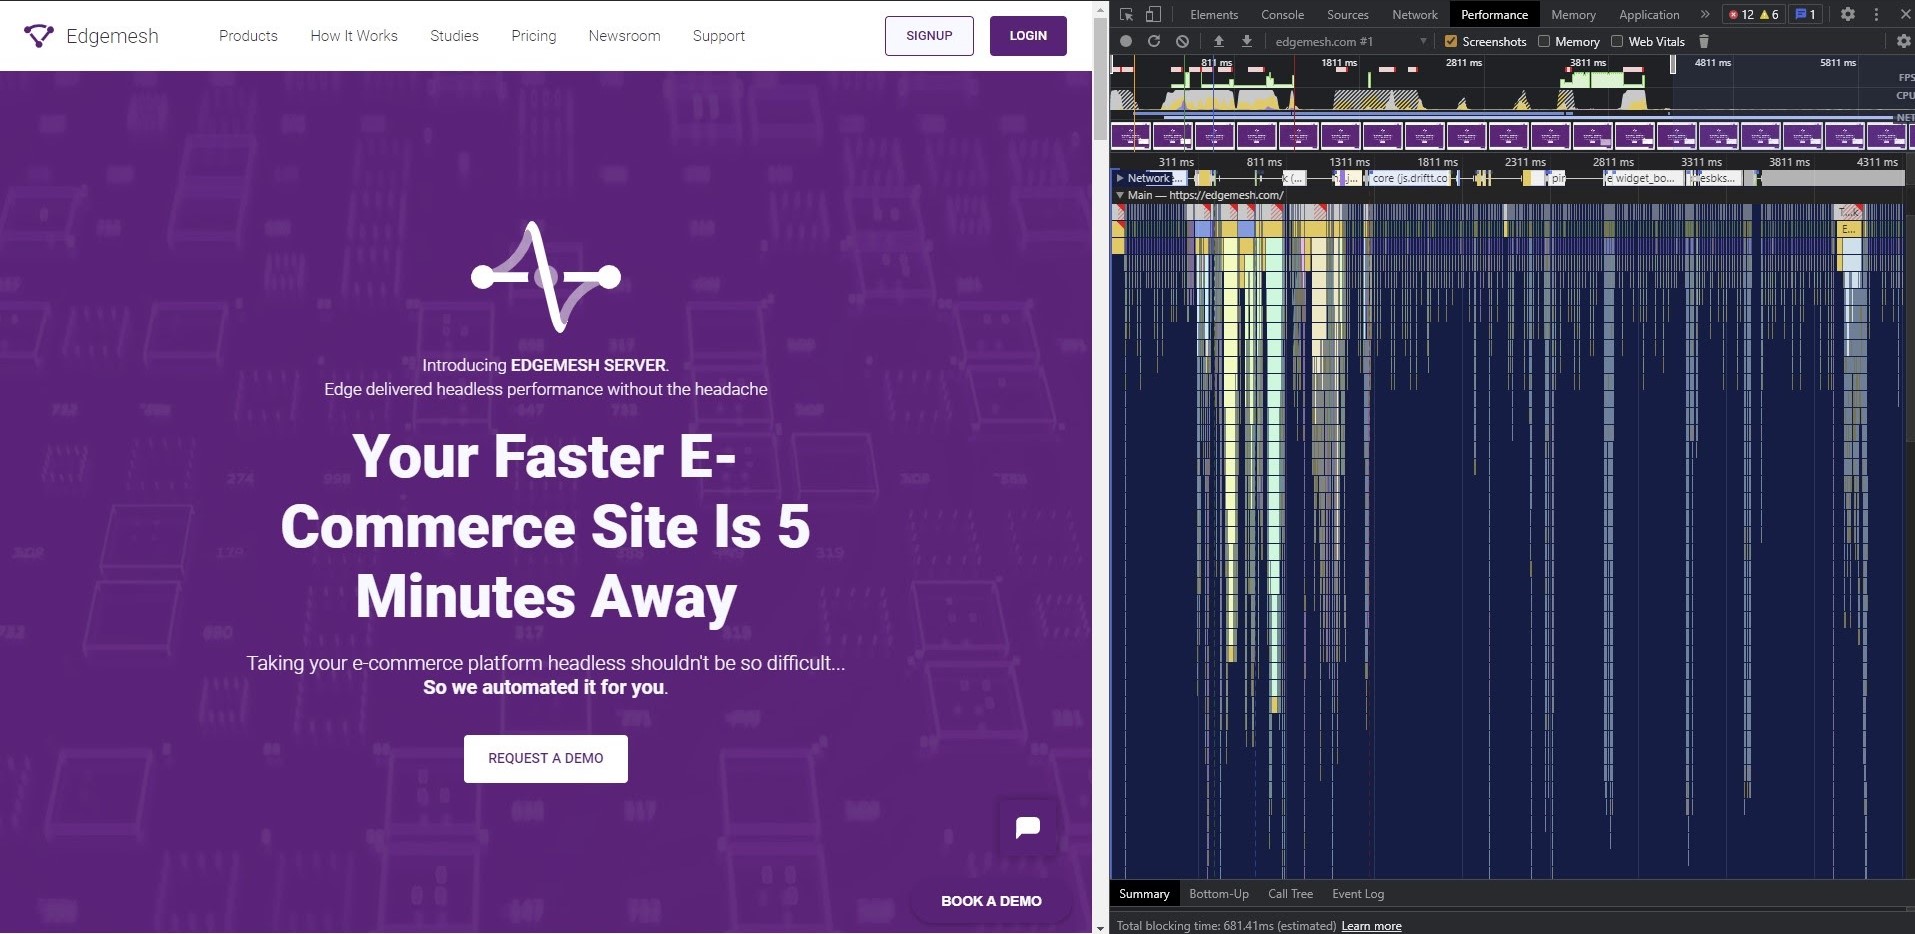
Click the reload button so the tool can profile your website. Below is an example:
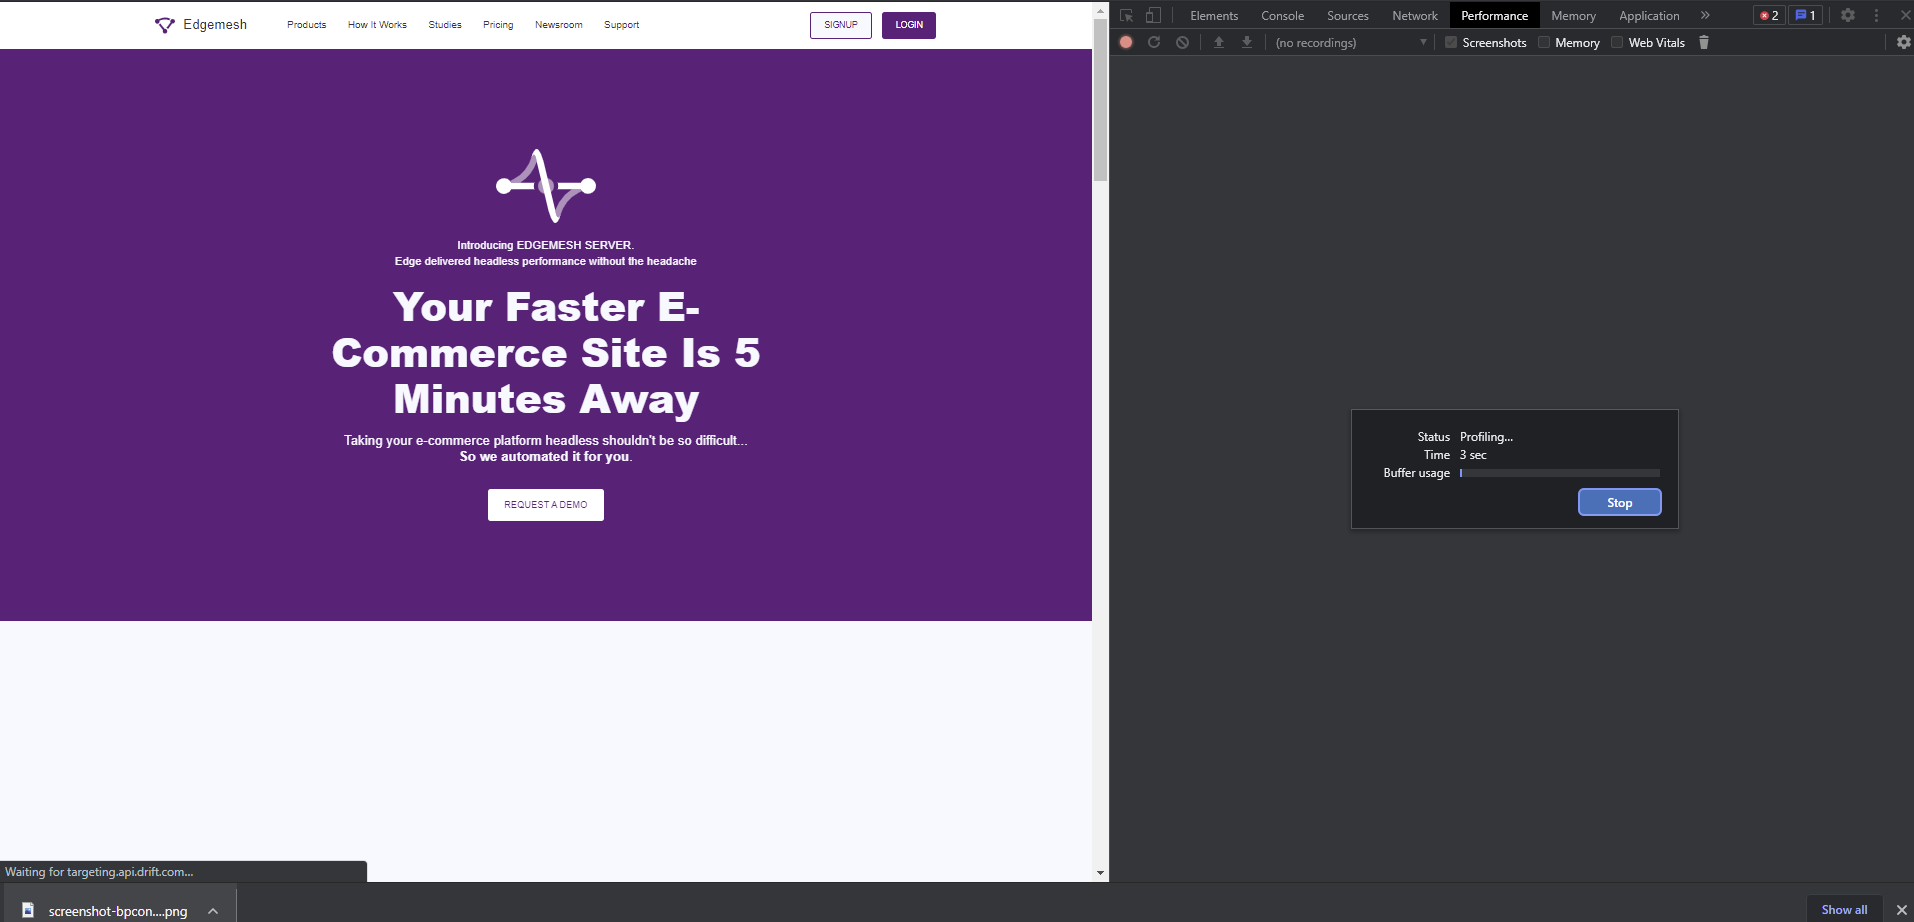
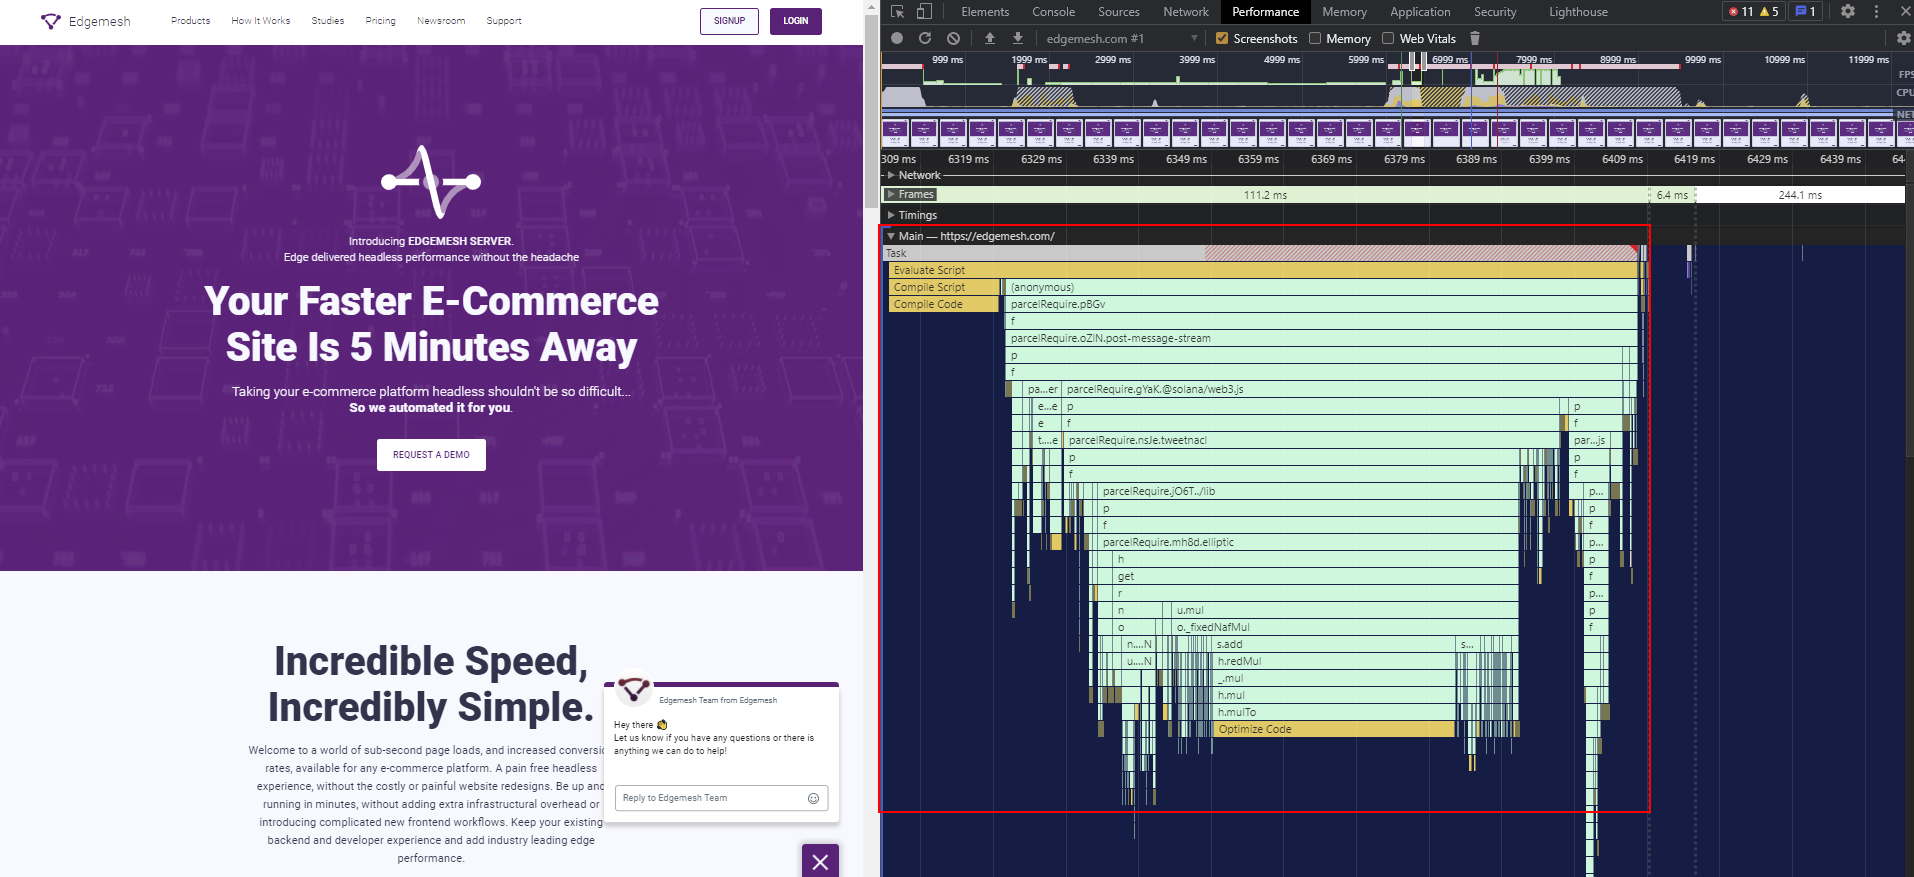
- When the tool finishes profiling your website, you’ll get something like this on your screen:
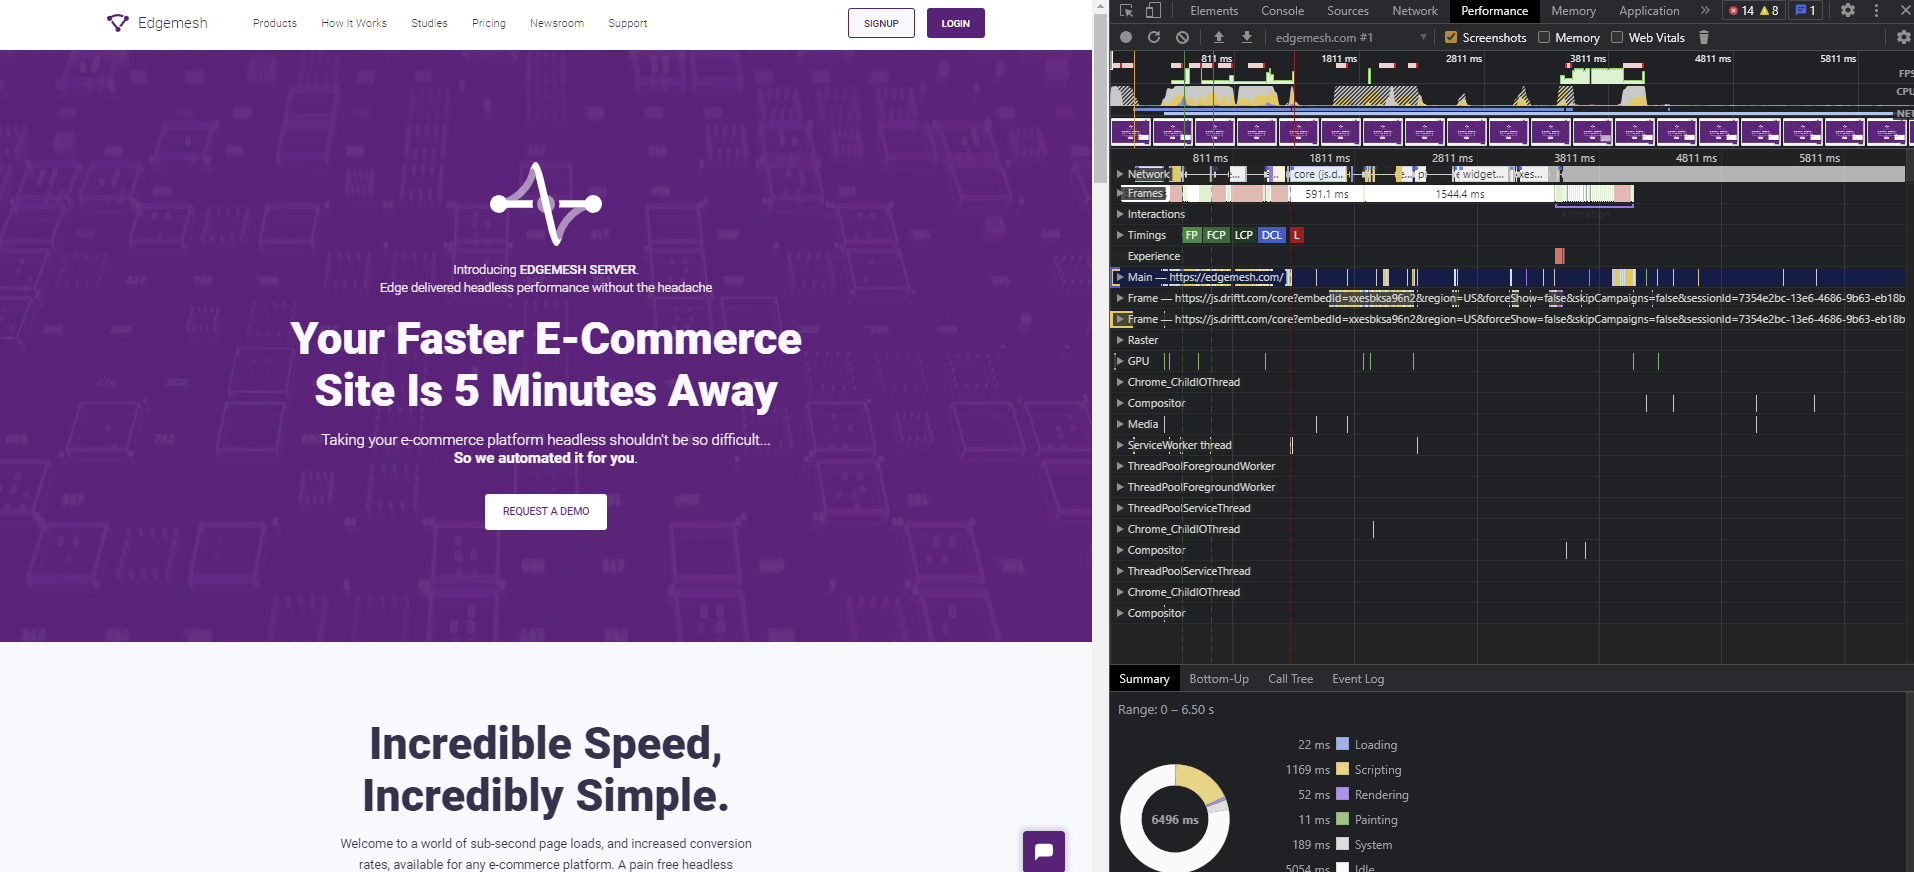
- It may look confusing at first, but don’t panic—scroll down and click on the main section to get a drop-down of the activity on the main thread.
- There are many activities on the main thread, but directly below the “main” section, you’ll see the lists of tasks that occurred.
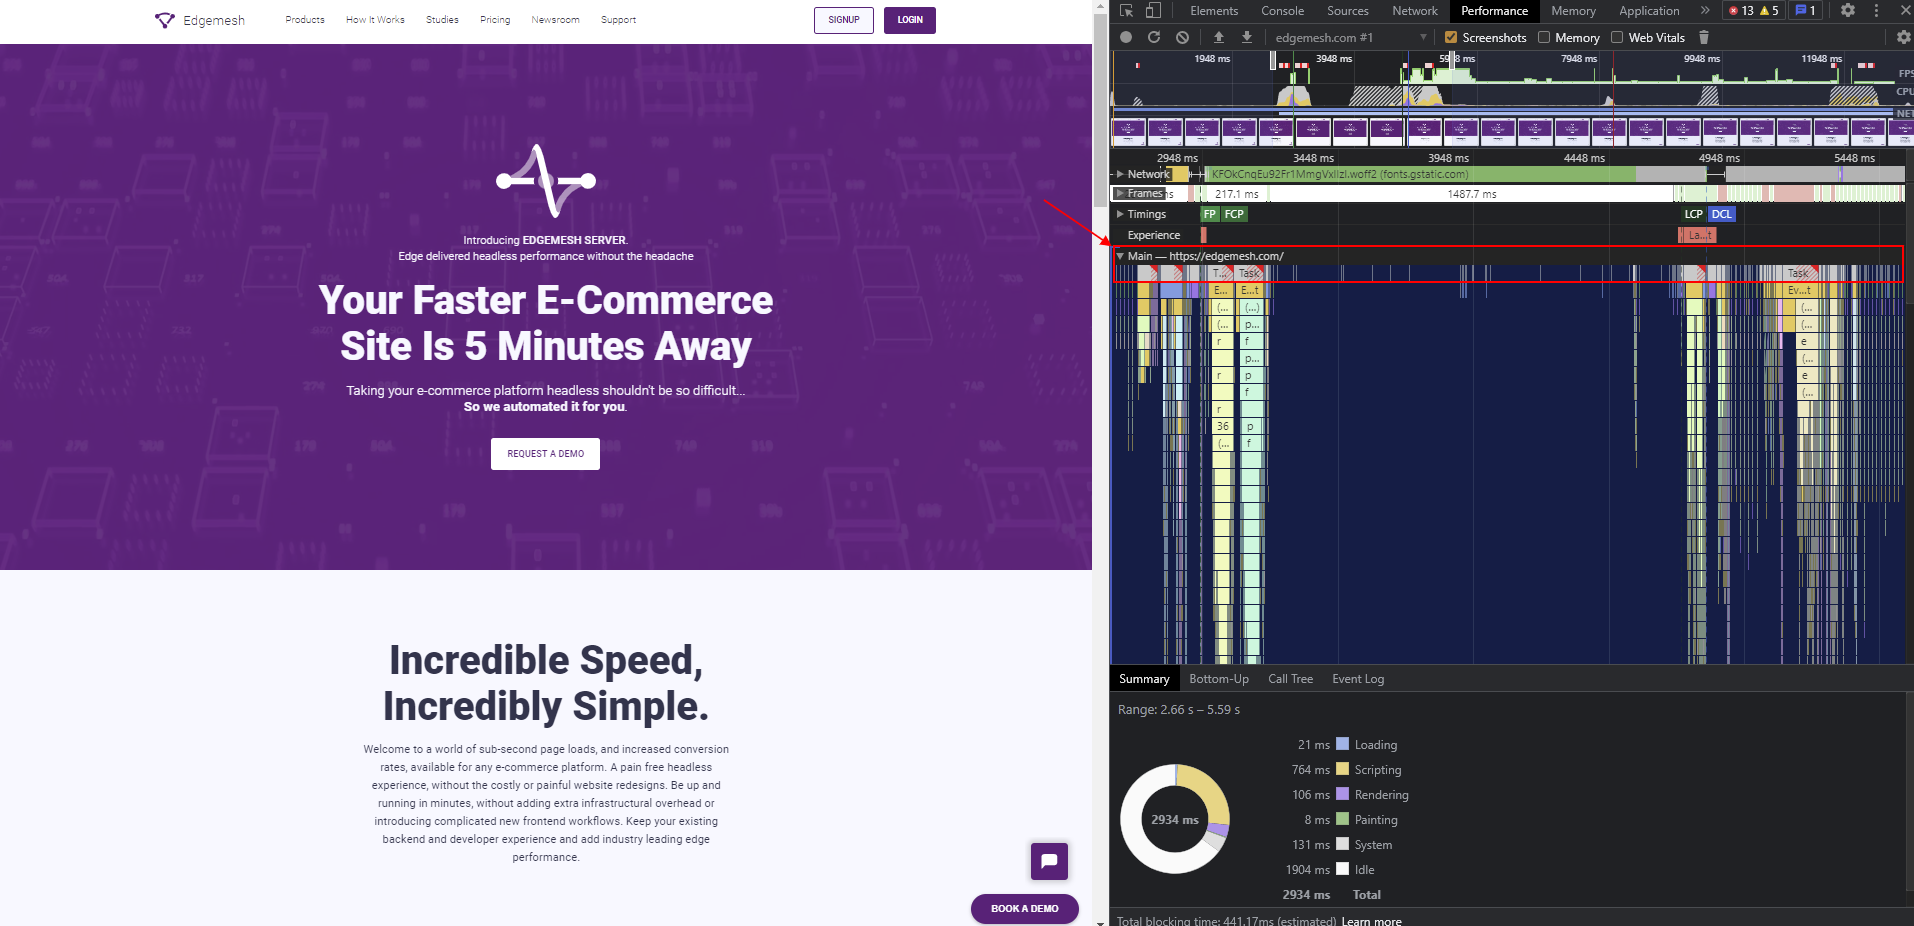
- Finding the long tasks can be tricky, with a series of tasks occurring on the main thread.
Luckily, ChromeDev Tools highlights long tasks over 50ms on the main thread with red shadings around the bars and regular tasks under 50ms with ash-grey.
—This is a regular task under 50ms.
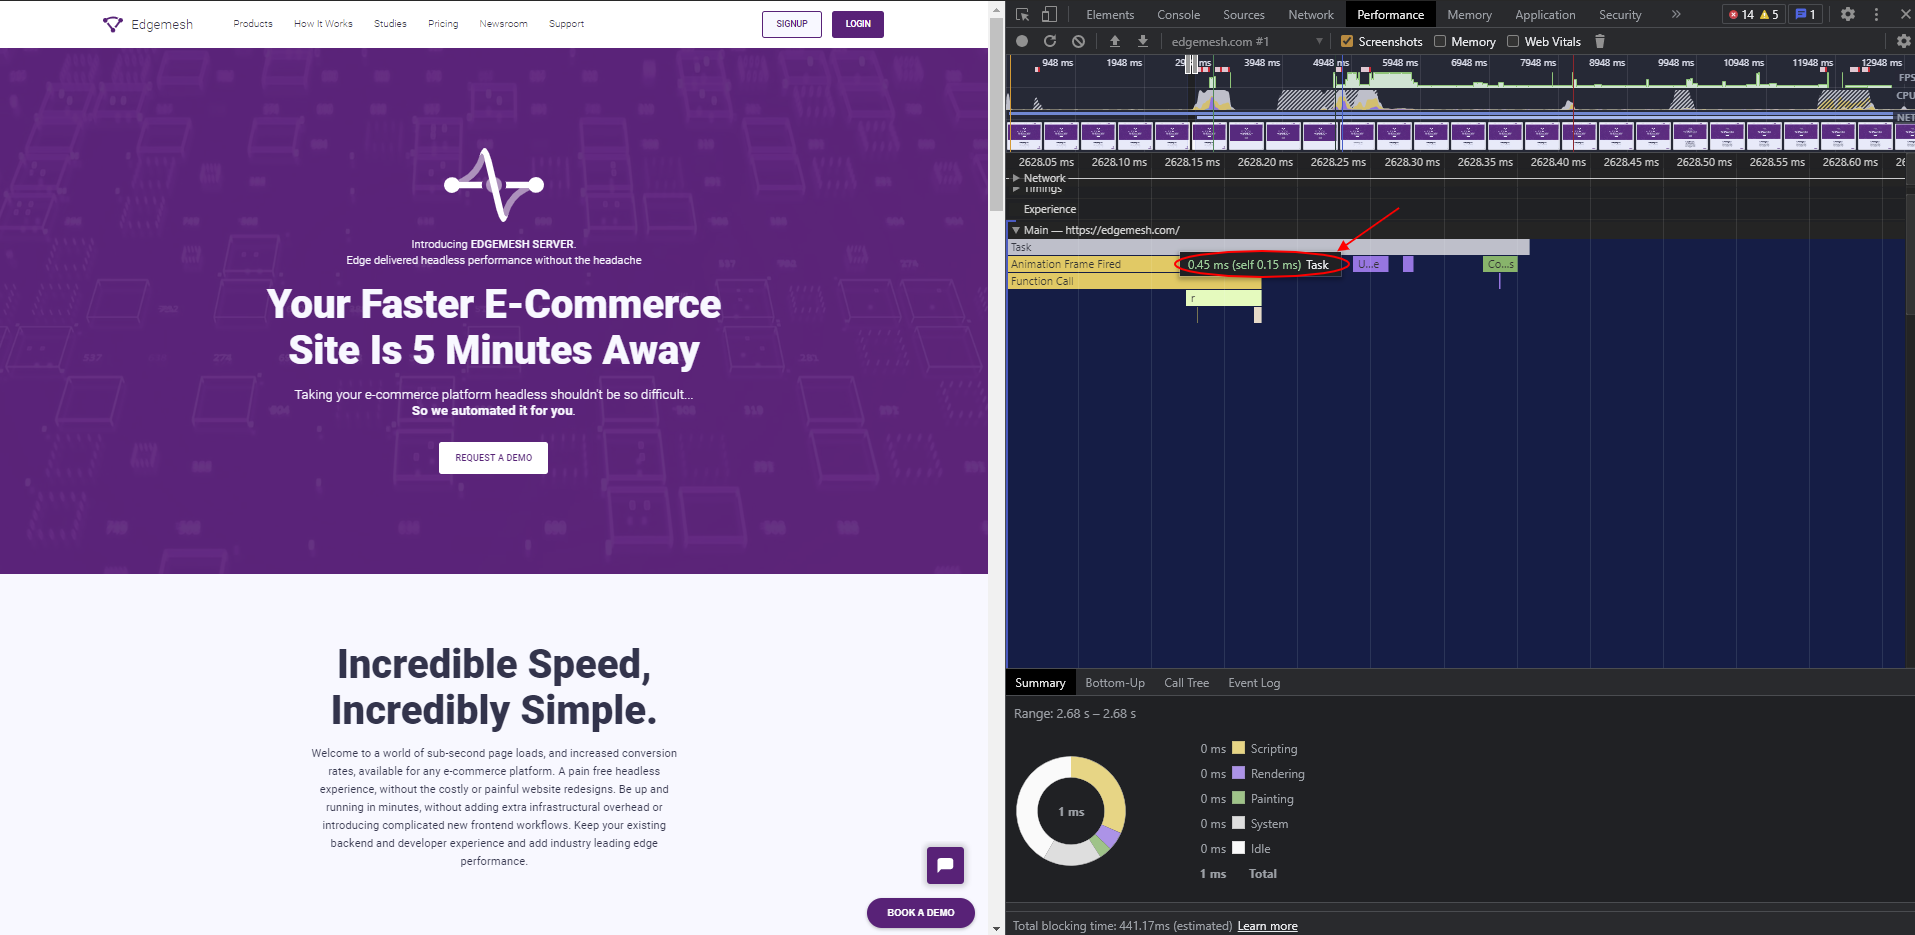
- When you click on this task, you’ll get a summary below of the total and self-time
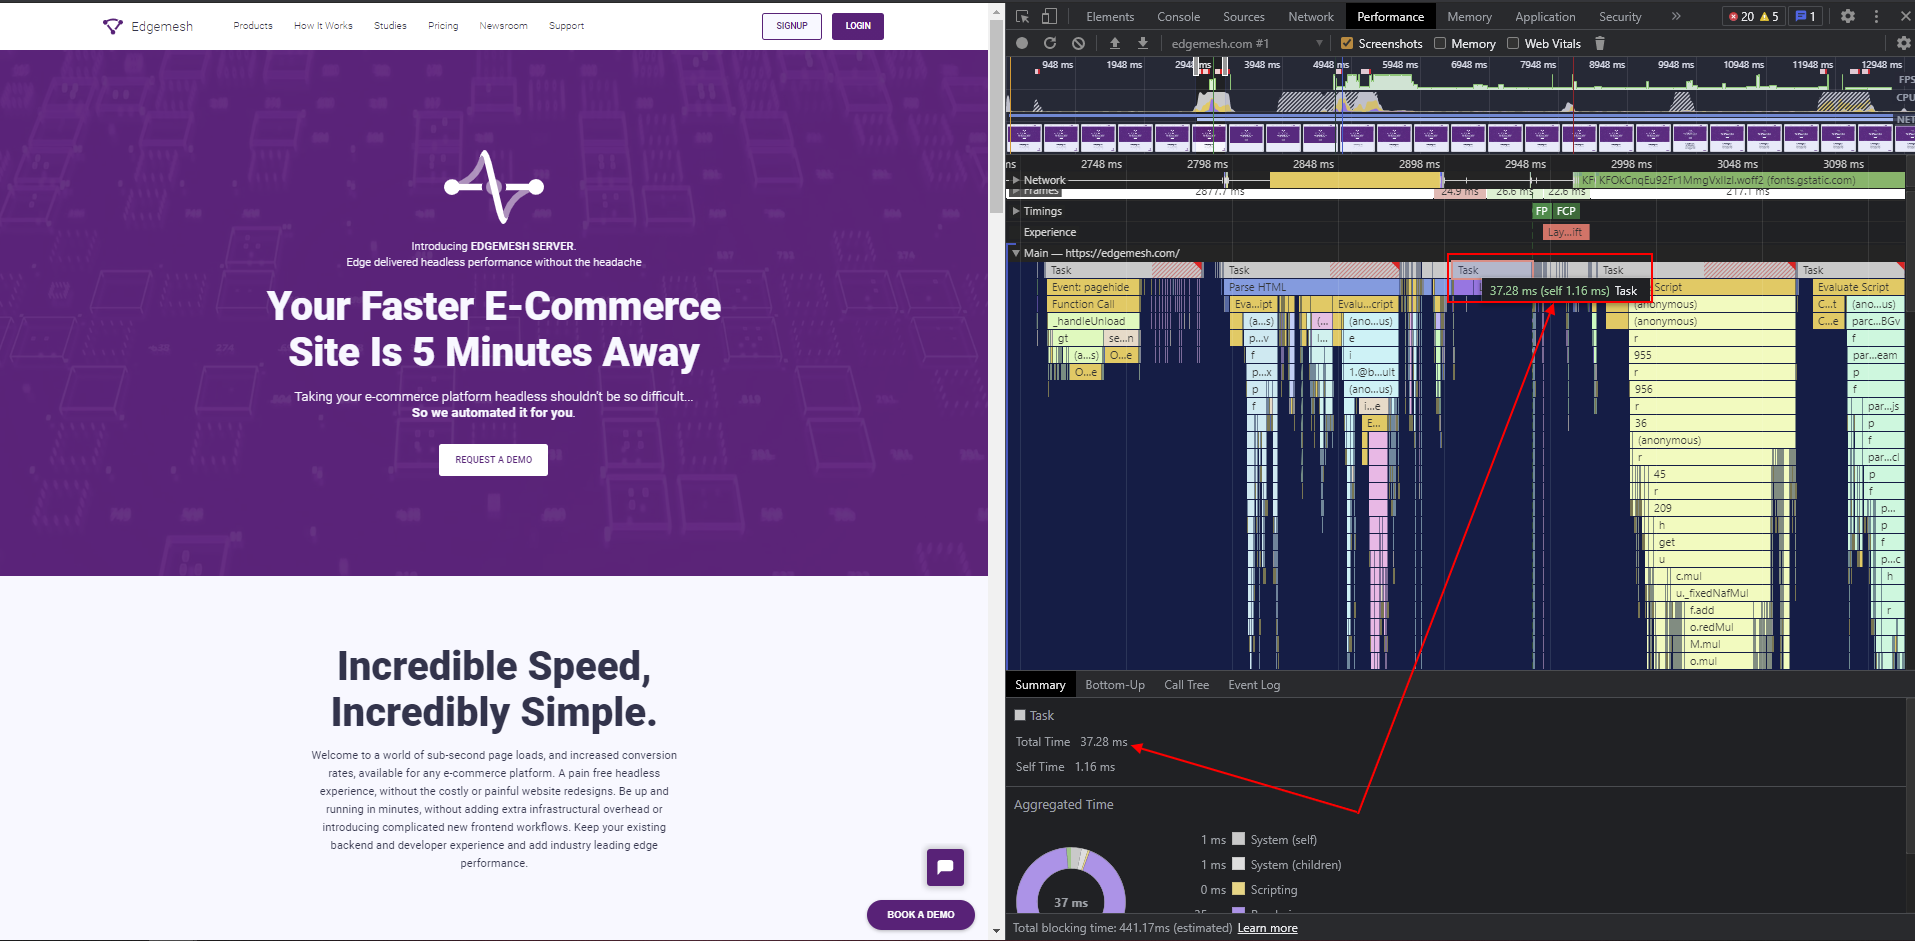
—This is a long task over 50ms.

- Clicking on the long tasks also gives you a summary that includes the total and self-time.

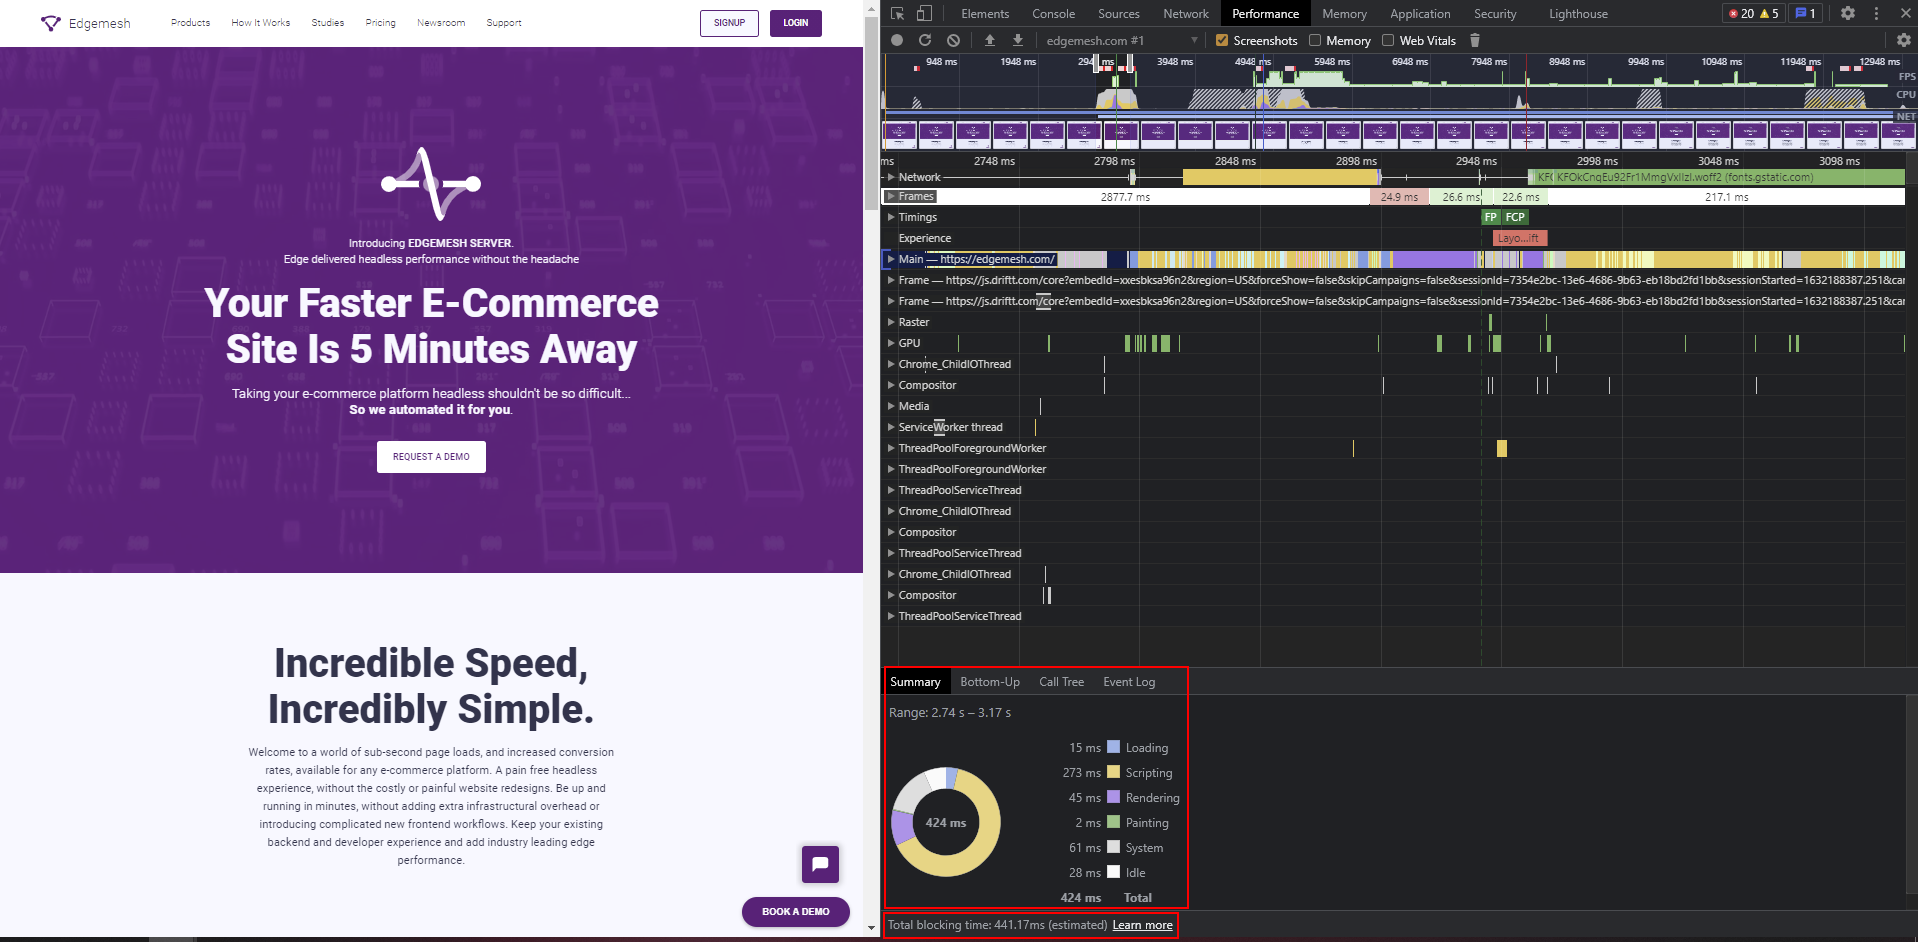
- With each long task, the ChromeDev Tools sums it all up from the initial loading event to the final rendering stage in the user’s viewport—all of which gives your total blocking time.
You can find this by clicking the main section to hide the drop-down, and your total blocking time will be directly below in the summary section.
And that’s all you need to know to measure your Total Blocking Time. Meanwhile, you should note that there are instances where your TBT records long tasks happening before the FCP.
In this case, you should neglect long tasks like this, since TBT measurement only starts from the First Contentful Paint and not before.
How to Improve Total Blocking Time
Javascript tasks on the main thread taking longer than 50ms before executing is the primary cause of TBT. The best solution is to build an entirely usable site that doesn’t rely on Javascript to function. But that’s not possible in terms of giving users the best user experience and website function. Knowing how to find these long tasks is half the solution; solving it is the other half. Below are four ways you can use to improve your TBT today:
1. Minimize the Workload on the Browser’s Main Thread
The browser’s main thread is where everything concerning a web page’s processing and rendering takes place. For example, the renderer process in the browser hosts the main thread and enables it to turn plain codes into a web page that allows users to interact.
The process goes like this: Script Evaluation —Style & Layout—Rendering—Parse HTML & CSS —Script Parsing & Compilation—Garbage Collection
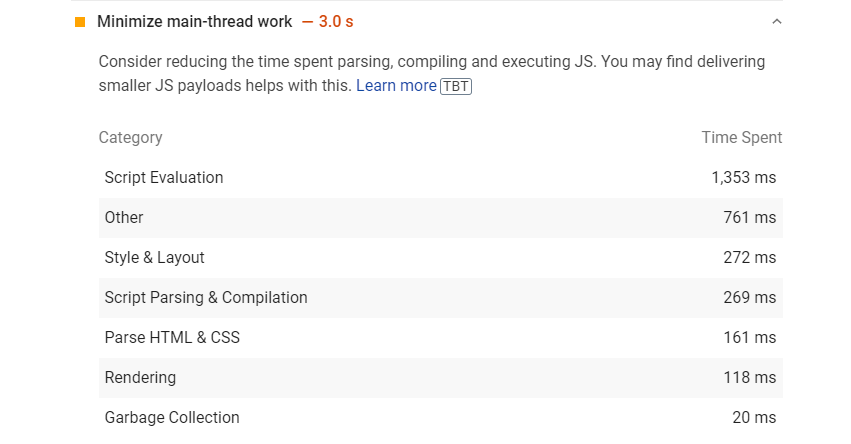
Using Lighthouse, you can easily get a breakdown of the workload on your main thread and know where more CPU time was spent loading your website.
You can also see this breakdown in ChromeDev Tools:
With these results, you can easily learn which of the processes on the main thread is taking more time than it should and optimize it.
In our results, we see that Script Evaluation is higher than it should. The same goes for other processes, too. If you find yourself in this scenario, here are some methods you can use to fix each process:
- Script Evaluation
- Debounce your input handlers
- Use service workers
- Optimize third-party Javascript
- Style and Layout
- Avoid large, complex layouts and layout thrashing
- Reduce the scope and complexity of style calculations
- Rendering
- Stick to compositor only properties and manage layer count
- Simplify paint complexity and reduce paint areas
- Parsing HTML and CSS
- Extract critical CSS
- Minify CSS
- Defer non-critical CSS
- Script Parsing and Compilation
- Reduce Javascript payloads with code splitting
- Remove unused code
- Garbage Collection
- Monitor your web page’s total memory usage with measureMemory(.)
2. Reduce the Impact of Third-party Code
Third-party codes are an external part of a website that makes it function seamlessly. Adding plugins, integrating social media buttons, or installing external services to your website can affect the browser’s main thread in parsing and rendering your website.
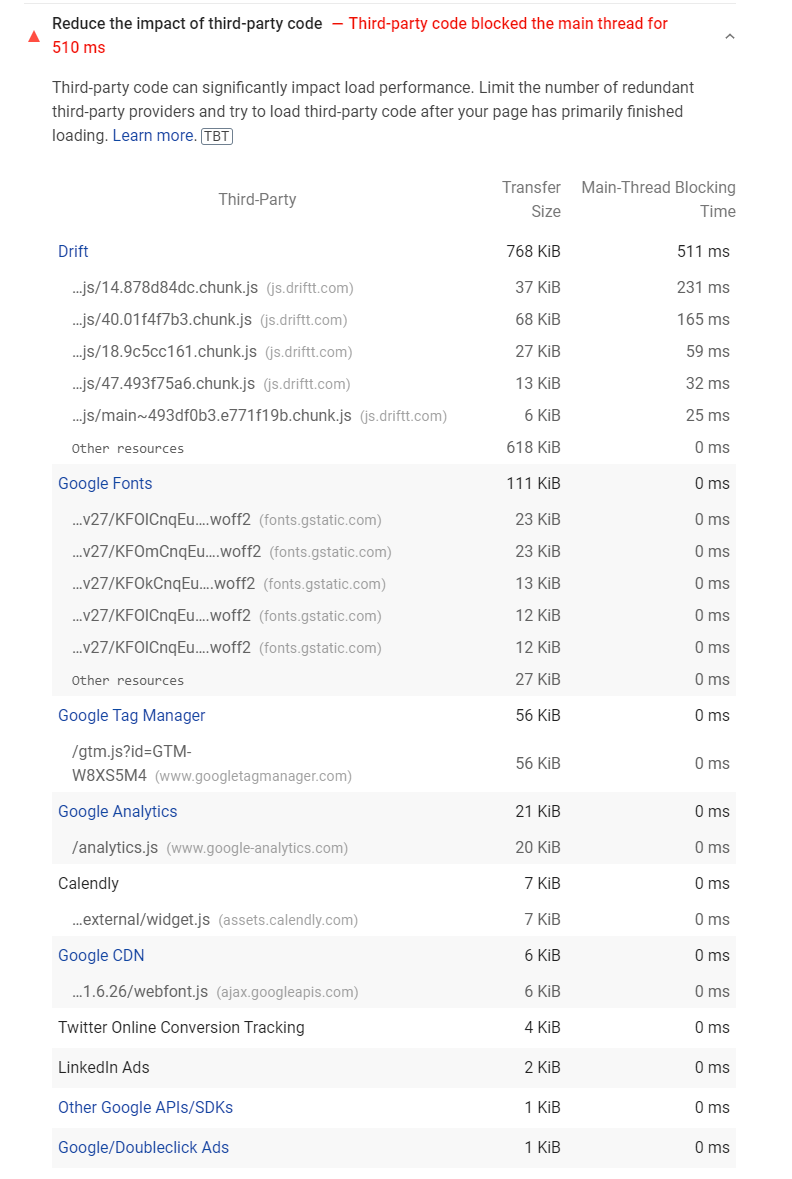
If these third-party codes are not fully optimized for your website, they result in:
- Blocking the window.Onload event with unoptimized iframes
- Delaying the browser’s main thread with long tasks
As a result, it’s vital to optimize or reduce the third-party codes on your website. To do this, you can begin by analyzing all the third-party codes on your website and remove the ones that don’t affect your website’s functioning.
3. Keep Request Counts and Transfer Sizes Low
Each element on your website has its size, so when the browser requests that element, it fetches all of the data, including the size, which transfers from the browser down to the server, before it displays to the user.
If the number of requests from the browser to the main server is high, the data of each element accrues in making the transfer size heavier than the main thread can handle.
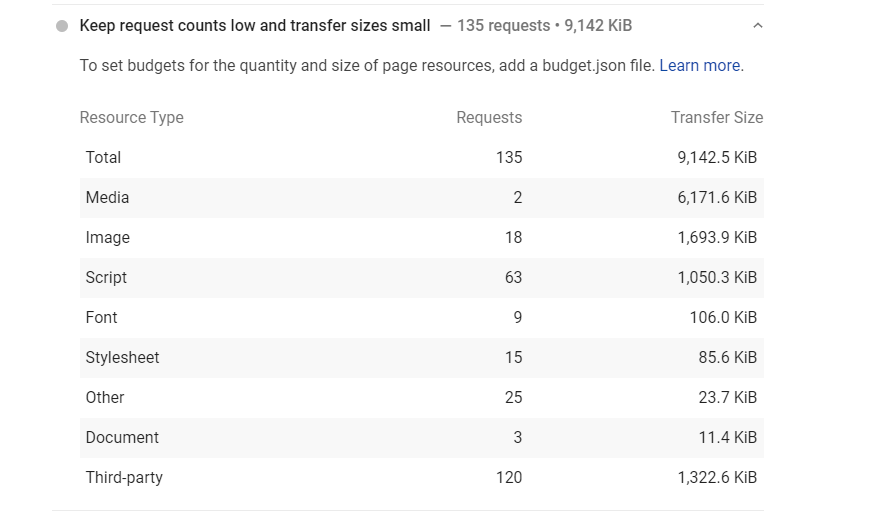
Since Javascripts handle all requests made on the websites, Lighthouse recommends optimizing your codes to reduce request counts and transfer sizes by setting performance budgets for your page resources. You can do this by adding a budget.json file to prevent regressions.
4. Reduce Javascript Execution Time
The time it takes for Javascript to finish executing is the main issue of total blocking time. Reducing Javascript execution time refers to minimizing the time spent compiling, parsing, and executing Javascript files.
If your Javascript doesn’t load as fast as it should, it poses these problems to your website:
- High memory consumption
- High network cost leading to longer download times
- Poor response to user input
When your website experiences all these, you’ll end up with a poor user experience that spreads far in affecting your overall load time.
The best way to reduce Javascript execution time is:
- Defer unused Javascript
- Implement code-splitting
- Compress and Minify Javascript codes
- Use the PRPL Pattern to cache your code.
— Preload important Javascript files
— Render the first paint
— Pre-cache important assets
— Lazy-load Javascript files
Overall, improving your TBT allows users to readily interact with your website once it loads. One major area of TBT is dependent on what renders the website.
If your website uses server-side rendering, you’ll mostly have a fast FCP score because Javascript has not started loading. This causes a significant problem in user experience because the website looks ready to interact with the user’s viewport, but until the Javascript finishes loading, using the website is impossible.
However, this is different for website rendering on the client side. In this case, all website functions are on the client side—meaning, delivering the complete page from the cached location on the client without needing to fetch from the server.
Final Thoughts
Making user experience a priority in website optimization gives you multiple ways to improve your website. The same goes for a user metric such as Total Blocking Time, as it focuses on how responsive the website is to the user when it loads. The reaction of the user before, during, and after the load, is what makes up your website’s experience.
If any part of this experience negatively affects the user while interacting with your website, Google records this and shows you how you can improve. Ideally, when it comes to TBT, you’ll want to target under 300ms and focus on optimizing all of your Javascript codes.
Keeping your website healthy should be your primary goal. Regular website performance audits help you see where else you might need to optimize for better performance.
If you made it to the end of this article, then you’d be interested in the rest of this series.
Below are related articles we think you’ll find helpful:
The Complete Guide to Google’s Core Web Vitals: What is Largest Contentful Paint (LCP)?
Complete Guide on First Input Delay (FID)
What is Cumulative Layout Shift (CLS)?
What is Conversion Rate Optimization?
Do customer experience, good conversions, low bounce rates and overall, speed matter to you? Then you’ll love Edgemesh’s Enterprise-Grade Web Acceleration.
Our intelligent, automated, and next-generation client-side caching readies your website to move at full speed—with just a single line of code. Plus, it takes under 5 minutes to set up.
What do you say?
Start your 14-day trial to get a feel for what speed means to your business.


