
How long can you wait after inputting a web address or clicking a link and all you see is a blank screen? 53% of web visitors say 3 seconds is their limit.
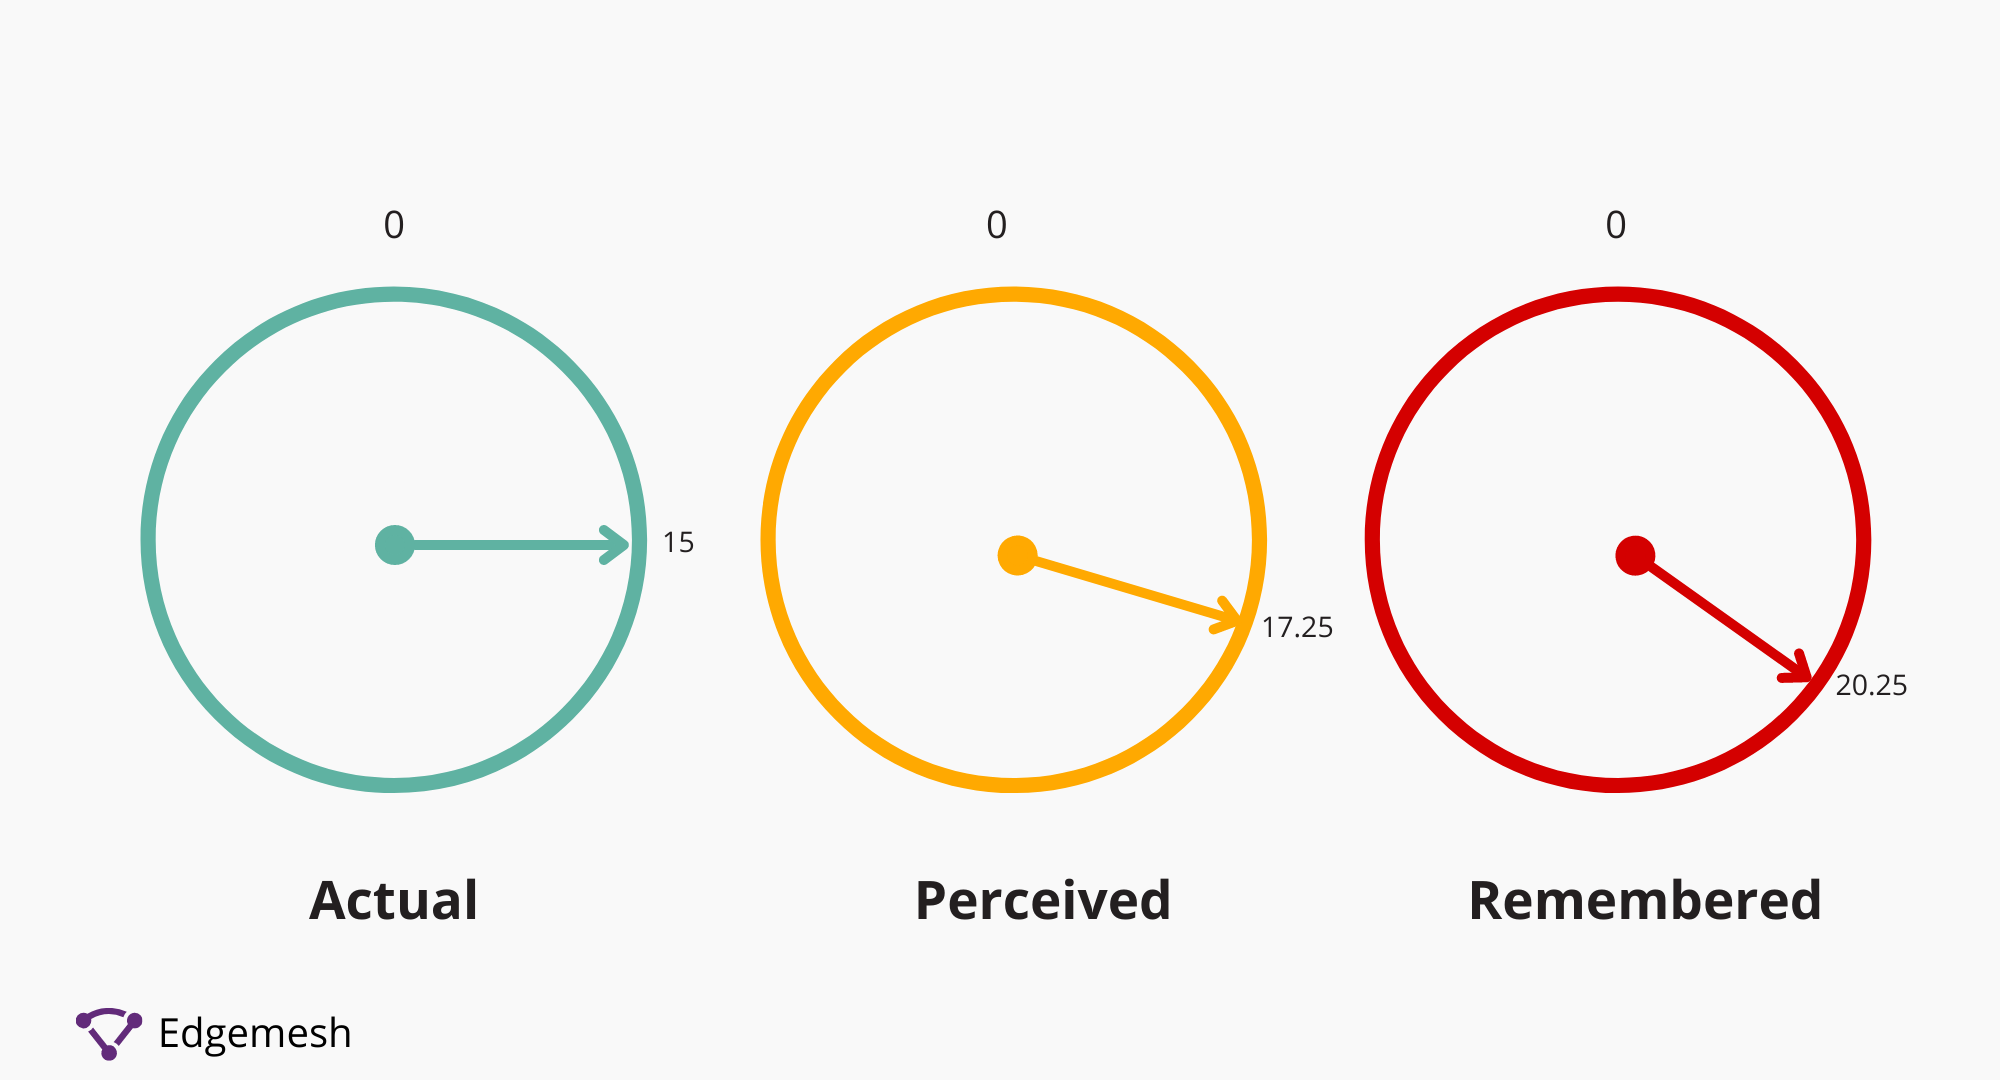
When it comes to web usability, our perception of time is different. As a web visitor, you will perceive a website’s load time is 15% slower if the response is not instantaneous and remember it as if it were 35% longer after that.
In other words, if a website loads in 15 seconds, the users perceive a 17.25-second load time. Later, the user remembers this as a 20.25-second load time.
A perception like this results in poor user experience and a high bounce rate. So, how do you solve this? Many factors contribute to poor load times on a website, but today, we’ll focus on the one metric that shows users a visual activity in response to their request.
This metric is called Start Render Time, and here’s all you need to know about it—and how you can improve it.
What is Start Render Time?
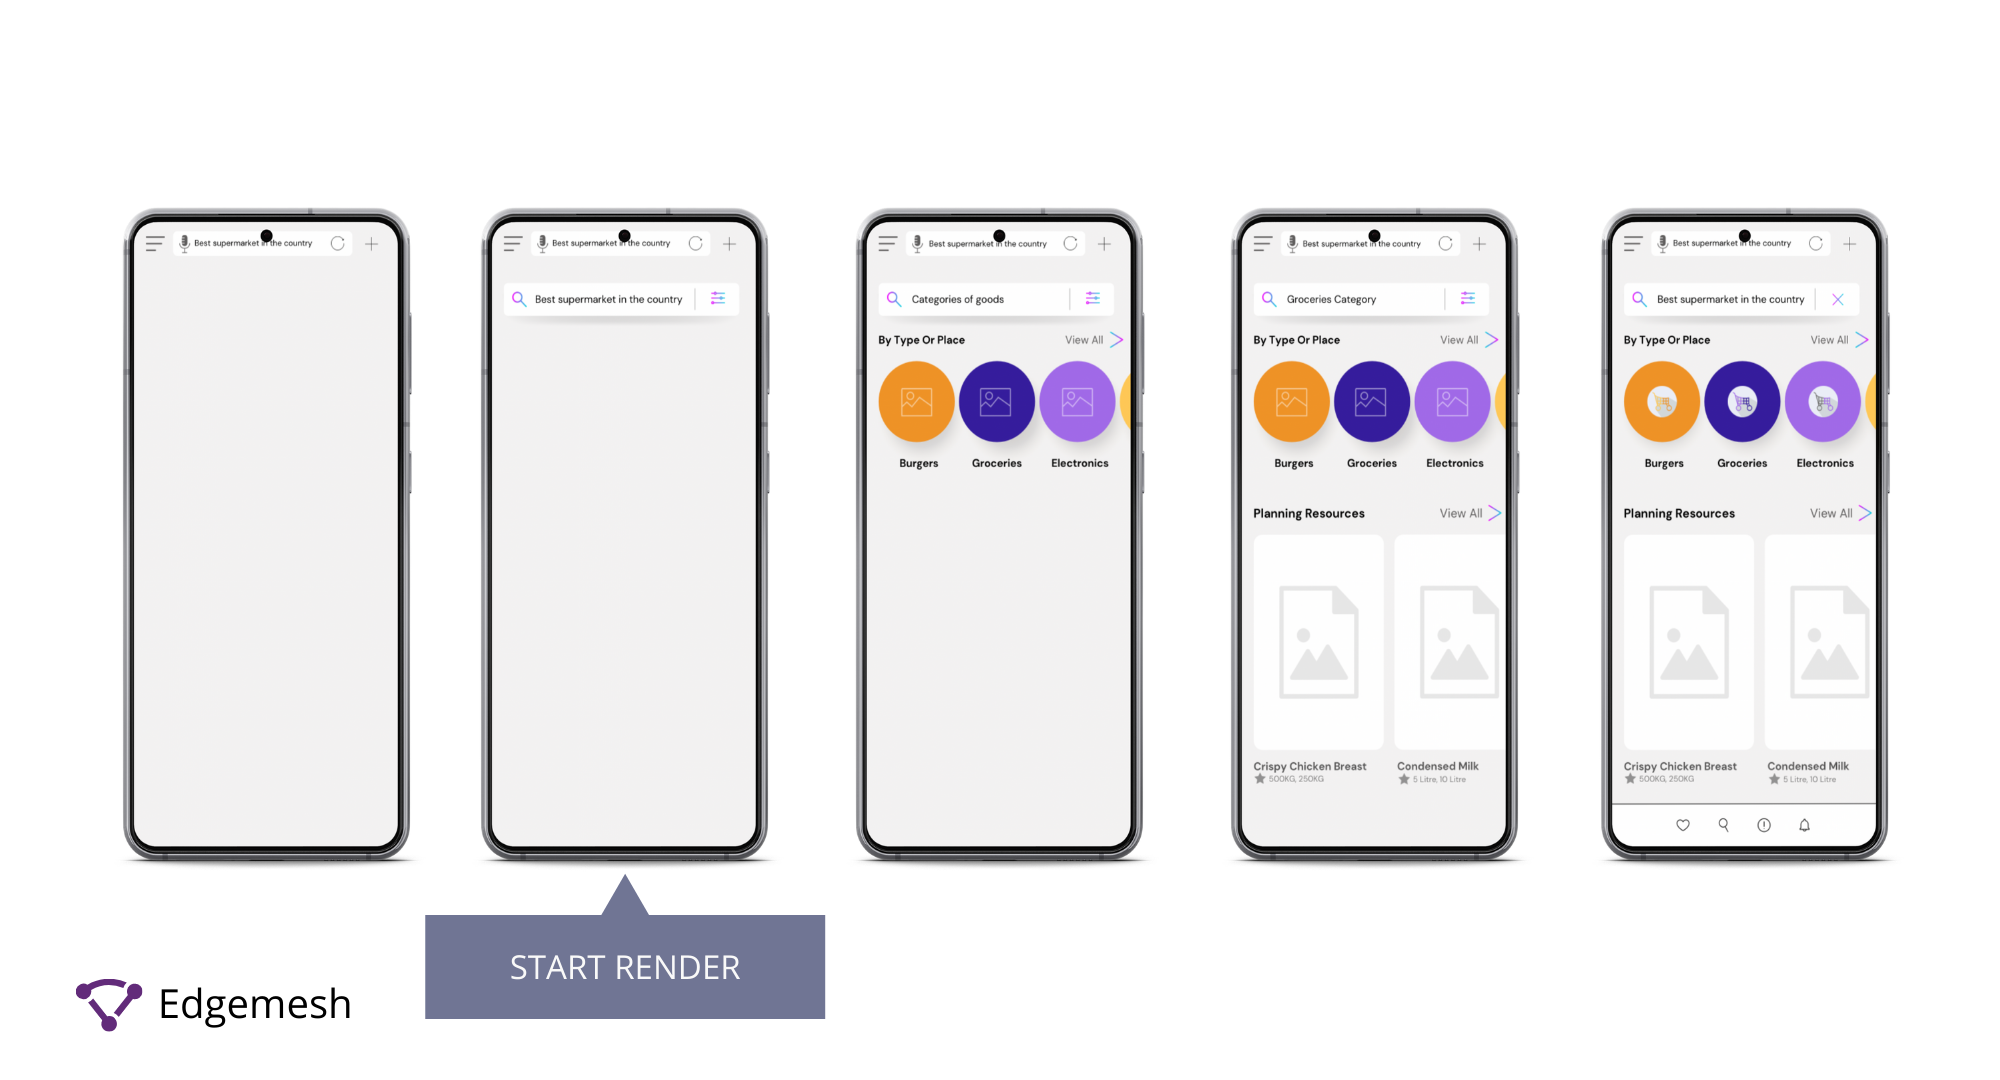
Start Render Time (SRT), or Time To Start Render (TTSR), is the metric that refers to the time it takes for a website or web app to load enough that the user can actually interact with the page. Specifically, Start Render Time is the time it takes for the DOM to complete and the window to load the event.
Start render time measures users’ experience in terms of speed from their perception when browsing the web.
From a user’s viewport, the web experience varies depending on the purpose of the visit. But the speed of the assets loading upon request is one out of many aspects that determine a website’s load time.
A fast load time is vital to reduce bounce rate, but you need your assets to load at the same speed because users can’t stare at a blank screen for long. With the first assets loading immediately, your website connects with the server, and your users would know they are on the right page.
To give users the best web experience, reduce your start render time. Luckily you can track this in the Edgemesh portal for full visibility!
But a good start render time doesn’t guarantee an excellent user experience. In some cases, as soon as the website loads and immediately displays the first assets, nothing else happens for the next 10-15 seconds on the page.
As a result, other factors such as First Contentful Paint (FCP), Time to First Byte (TTFB), server response time, time taken for HEAD to process objects in the document, and initial page rendering and parsing becomes another concern.
All of these factors determine how fast or slowly a website loads and how that affects user experience when browsing the web.
Why Both Start Render Time and Page Load Time Are Important In User Experience
The page load time comprises a series of processes that focus on fetching content from the server and displaying it.
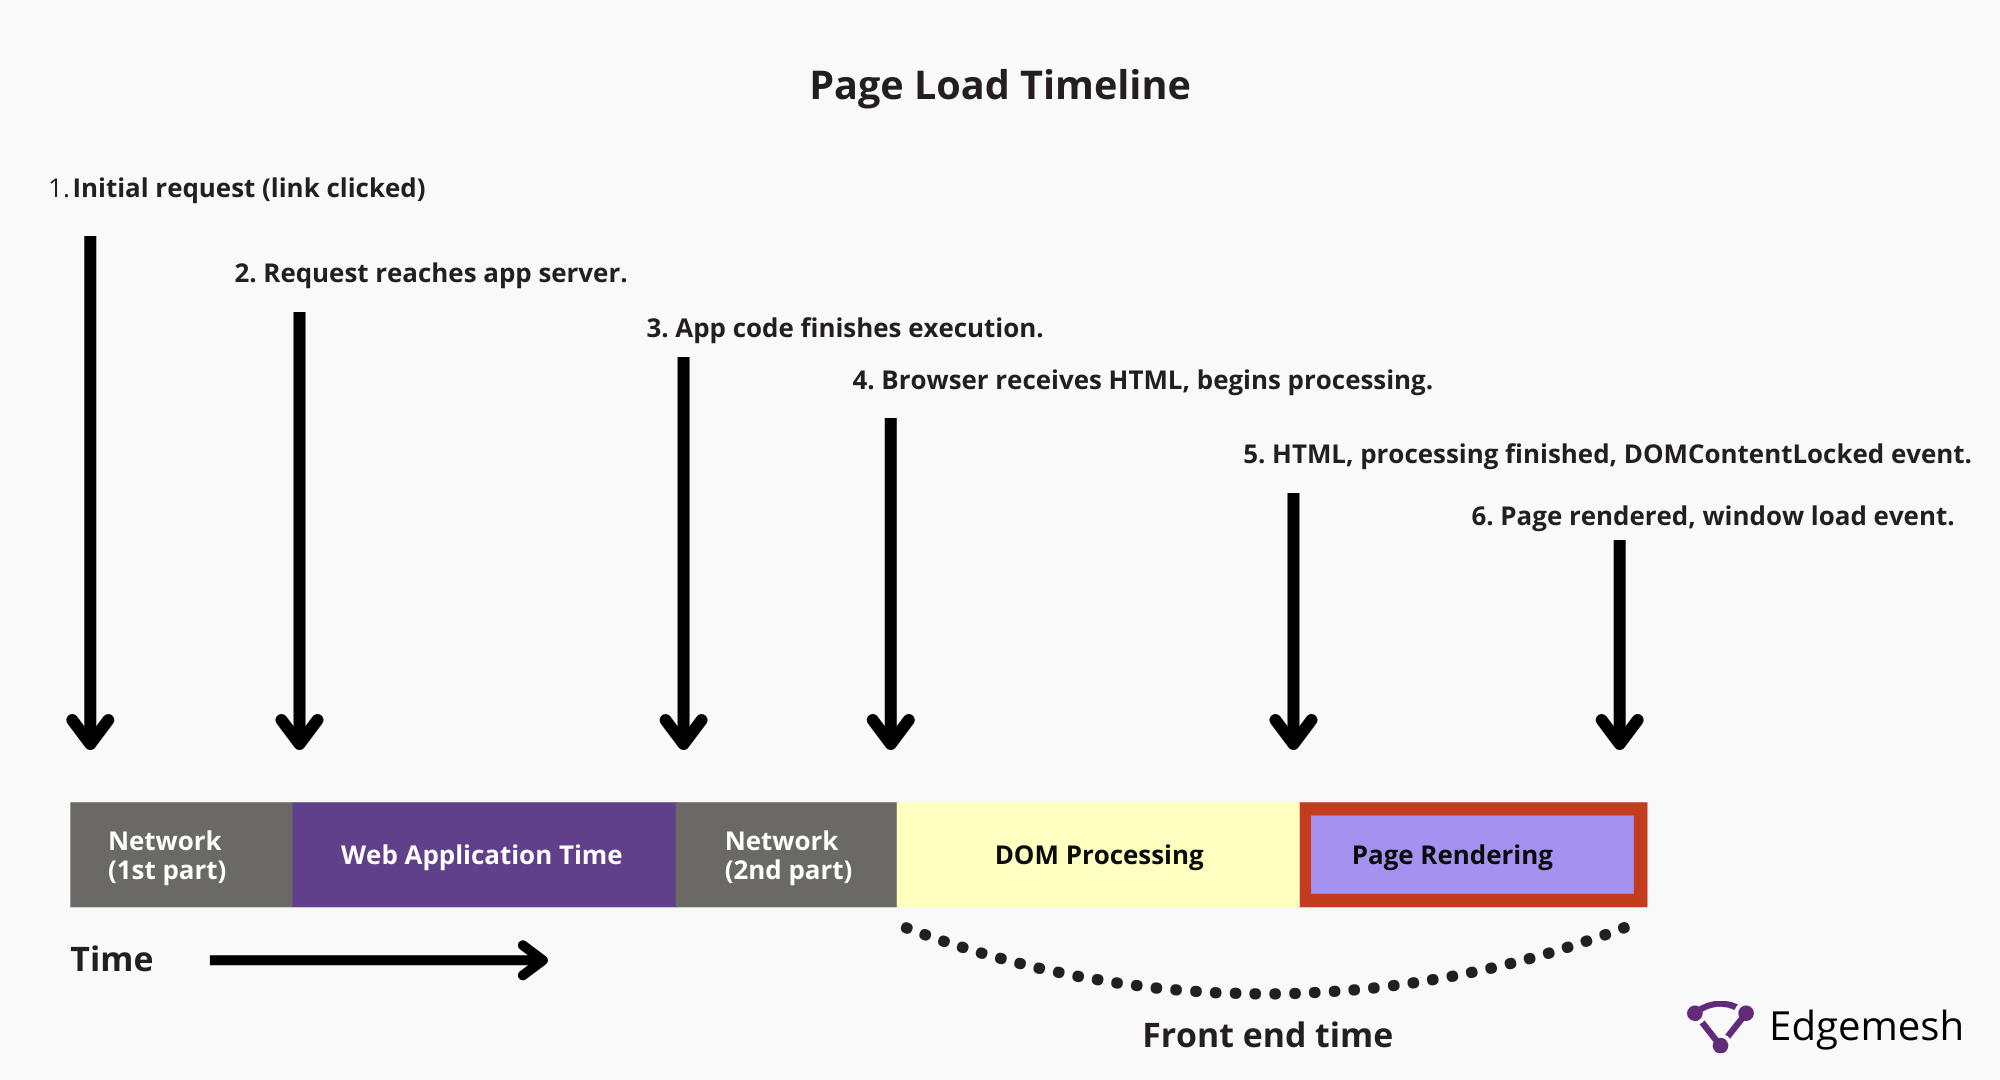
In all of these processes, the user starts interacting with the website beginning with the page rendering part, so that’s where user experience measurement starts. So, your page load time is as important.
Load time is not the only metric to determine the overall user experience, especially when you have external resources such as third-party plugins installed.
In some instances, external resources are still loading even after your page loads completely.
When users can’t interact with some aspects of your website due to it being unresponsive, their perception impacts their overall user experience.
Therefore, you should have a good start render time to ensure there isn’t a delay in the time assets load onto the website and their responsiveness to interaction.
But how do you know which start render time is good or bad?
What is A Good Start Render Time?
A good start render time is less than 750 milliseconds, and a bad start render time is anything over 2 seconds.
How Do You Measure Start Render Time?
Measuring start render time can only be done by noting the exact time the first interactive asset appears on the user’s viewport. This can be done in real time with the Edgemesh Portal, or on demand with a tool like WebPageTest by Catchpoint.
Measuring your Start Render Time
- Go to WebPageTest and enter your website’s address to start the test.

- Depending on your goal, you can modify the normal settings such as “Test Location” and “Browser.”
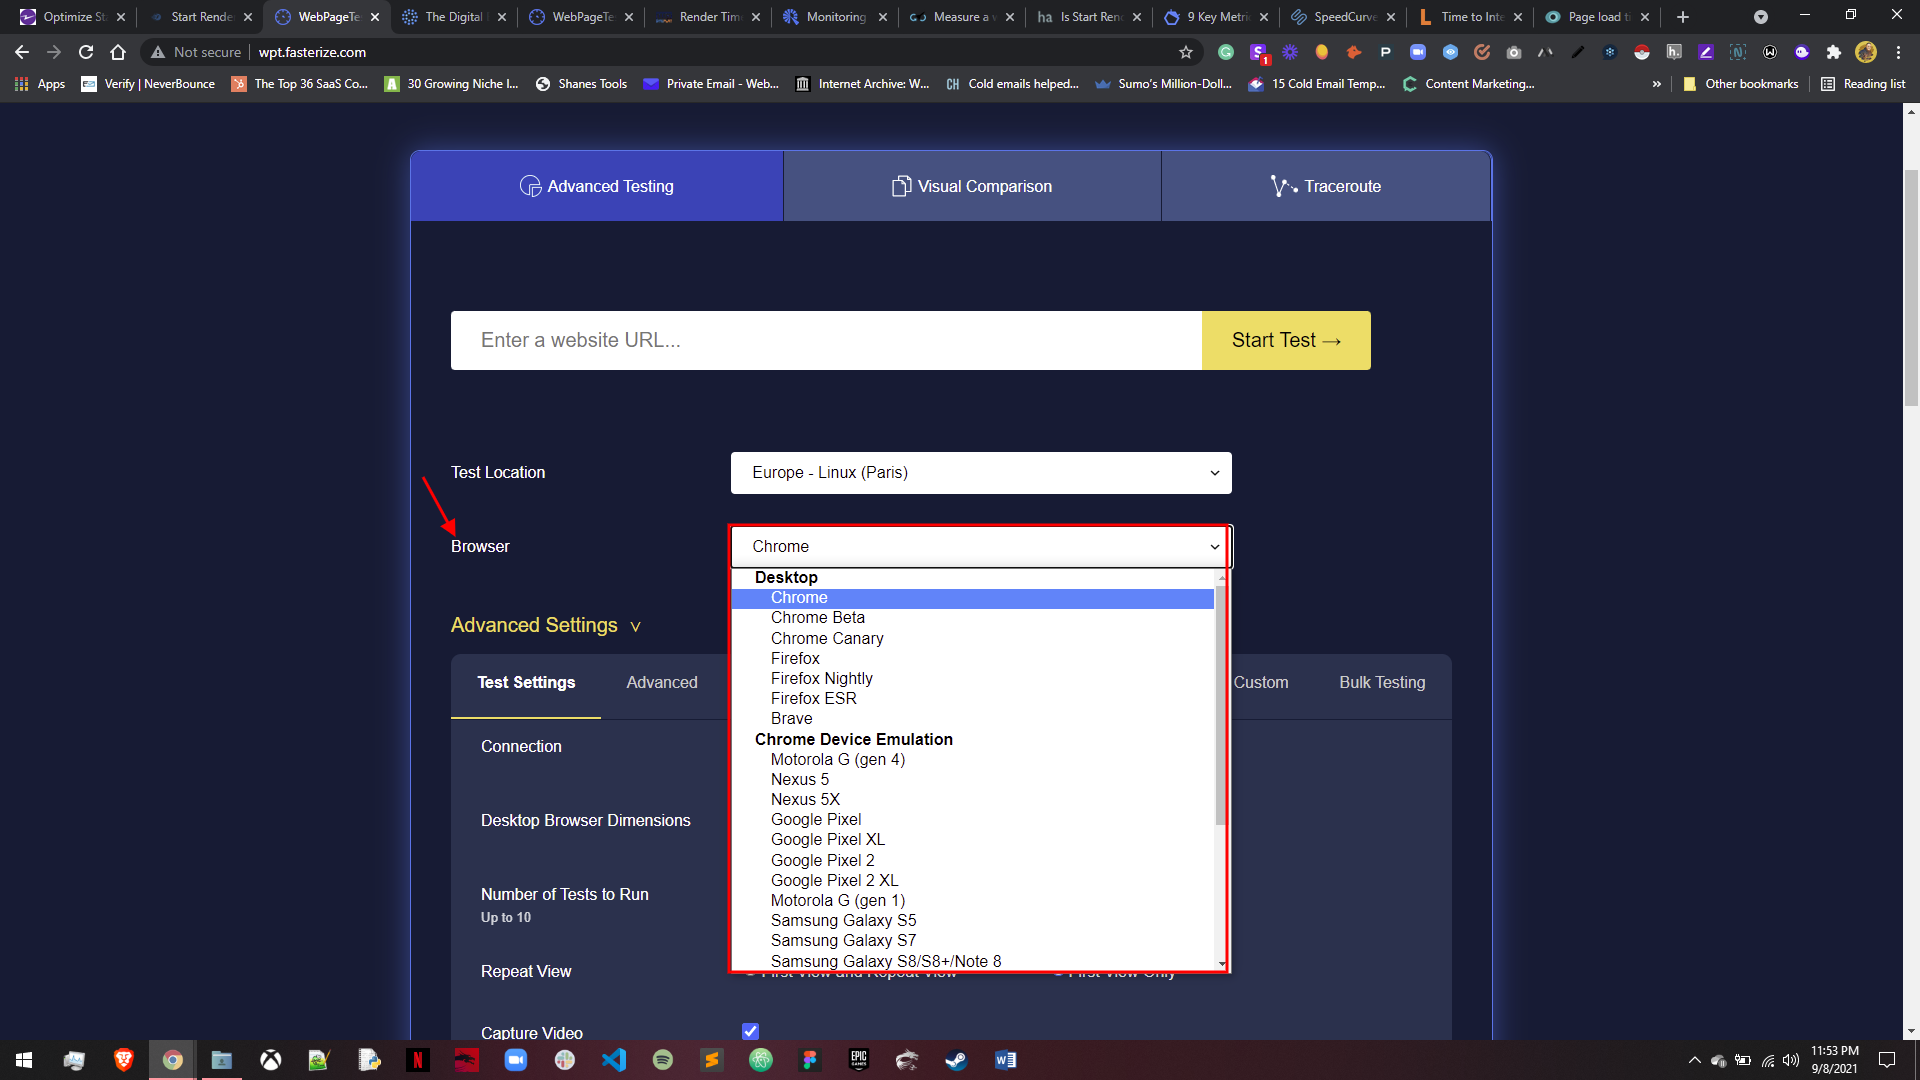
- The advanced settings cover more things you’re free to customize, such as your preferred connection type, number of tests, and desktop browser dimensions.
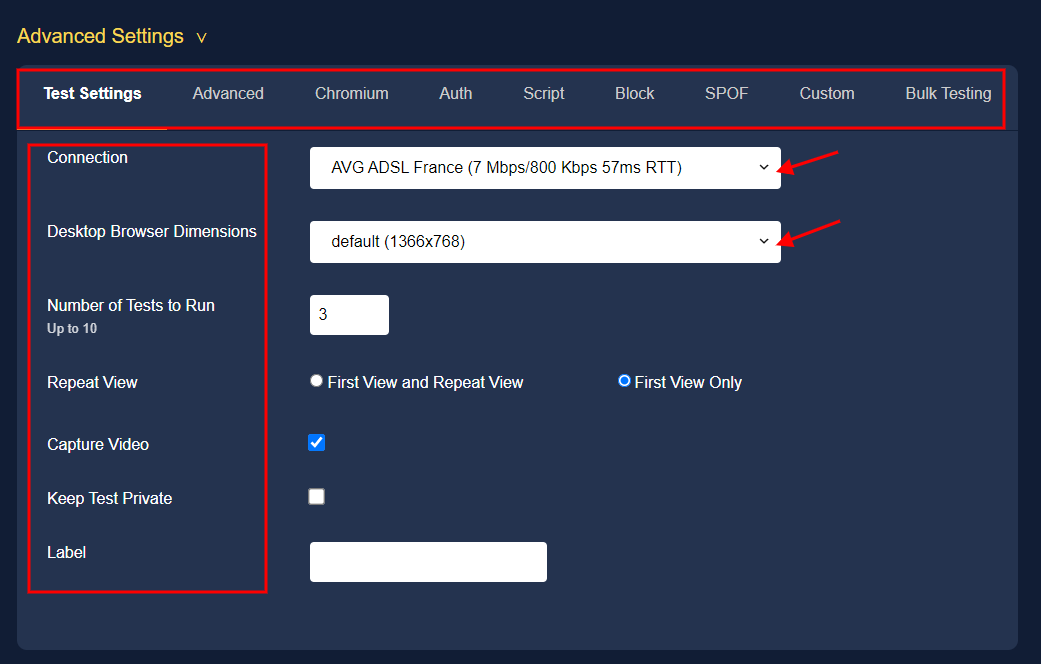
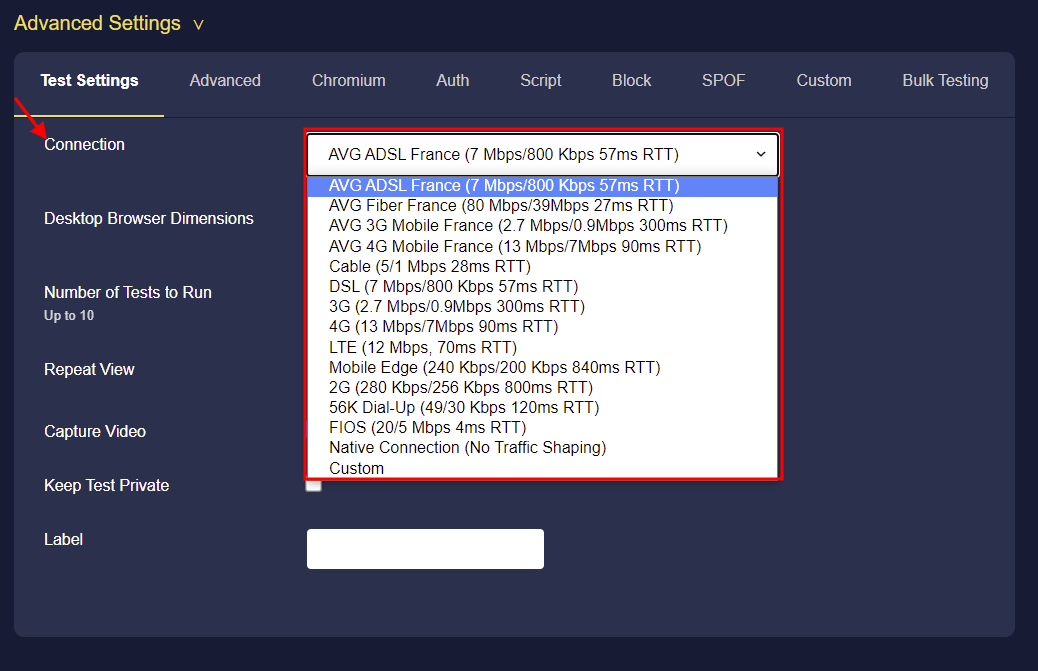
- Let’s say you want to change your connection: Simply toggle the options available and choose anyone you prefer. You can also do the same to other parts of the advanced settings.
- For this test, let’s use our website, Edgemesh. In measuring our start render time, we’ll run three tests and compare their results.
Understanding the Start Render Time Test on WebPageTest
- Once you click “start test,” the result displays like this:
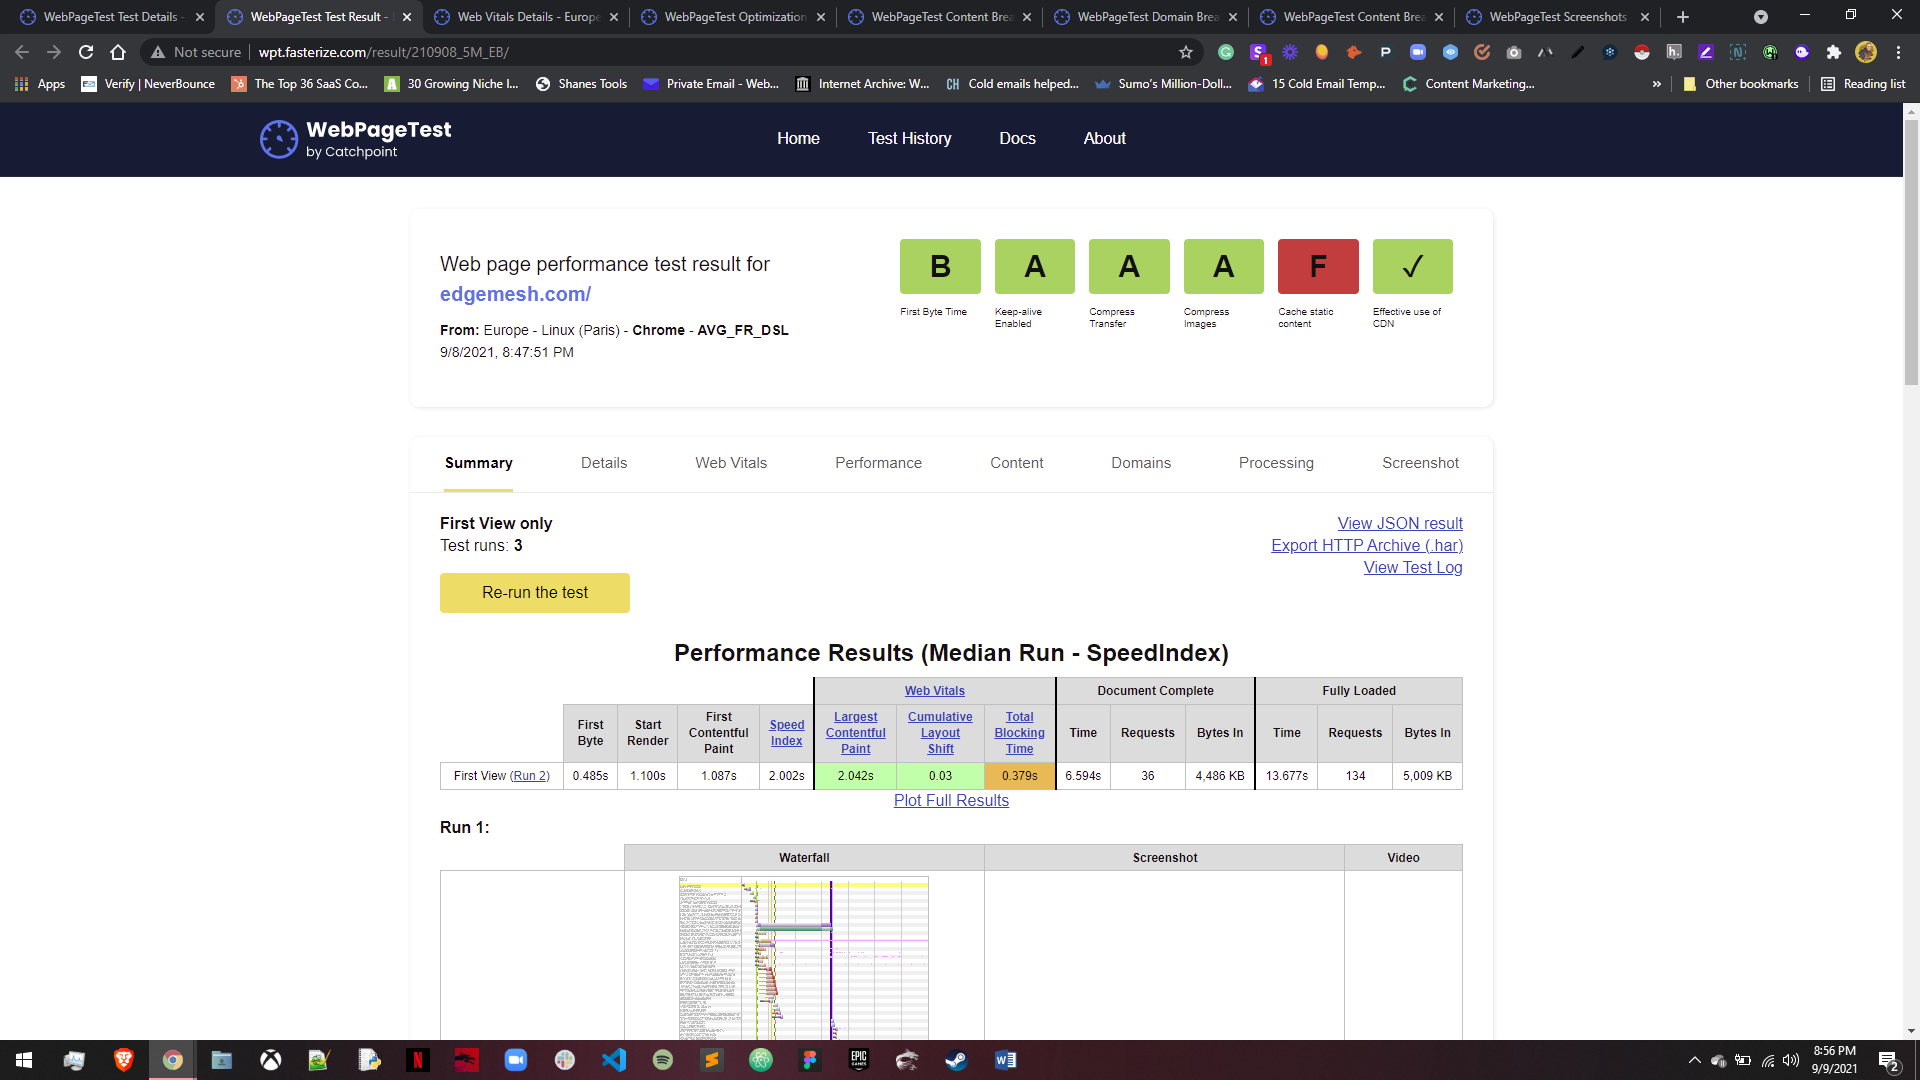
- The first section gives you the cumulative performance result of your website. Here, we’ll focus on “Start Render Time.”
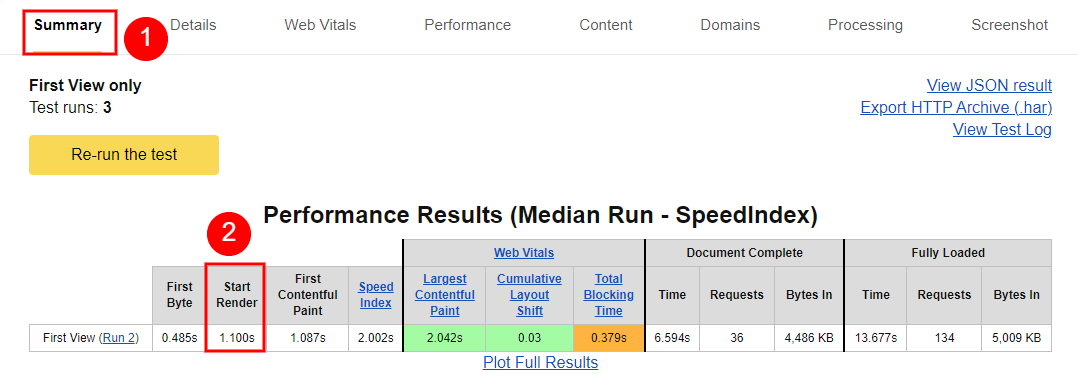
- After running the test 3 consecutive times, we can see our median start render time is 1.100s.
This alone answers our main query, as we have an excellent SRT score.
However, if you don’t have a good score and want to know more about what’s causing a poor start render time for your website, you can look into the details of each run.
You get the waterfall view, timeline, trace, processing breakdown, and a filmstrip of each process before and after content loads for the end-user for each run.
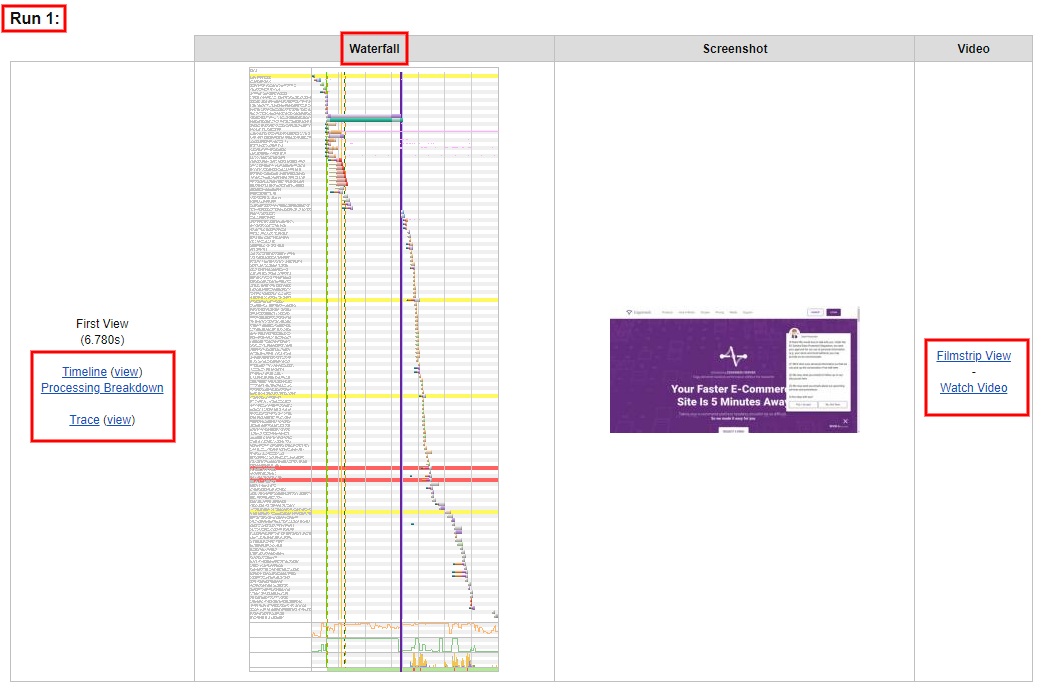

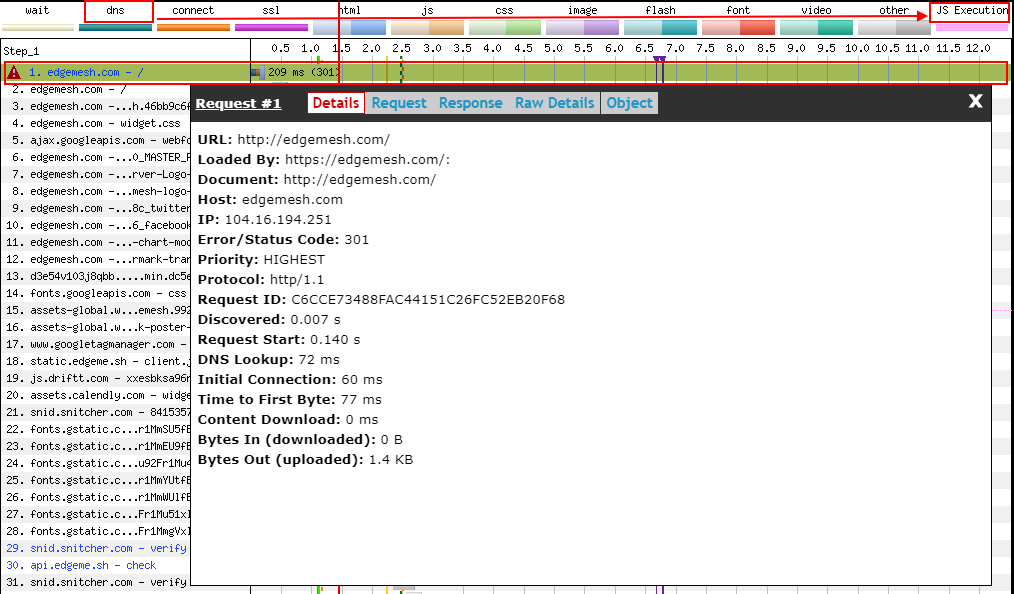
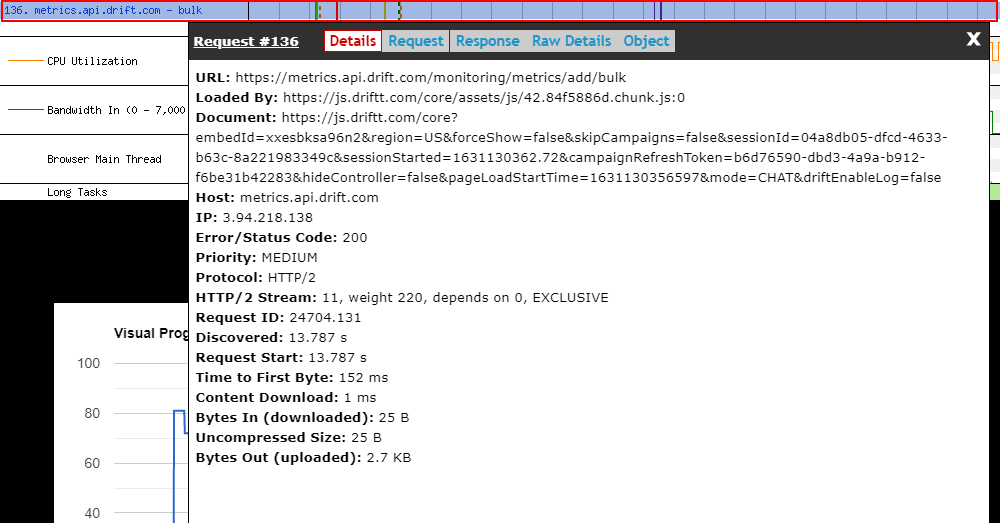
- To get a comprehensive breakdown of the number of requests your website makes before it renders, click on “filmstrip view” and scroll down to the “waterfall.”
In the case of our website, it took 136 requests (from DNS lookup to JS execution) before it was completely loaded.
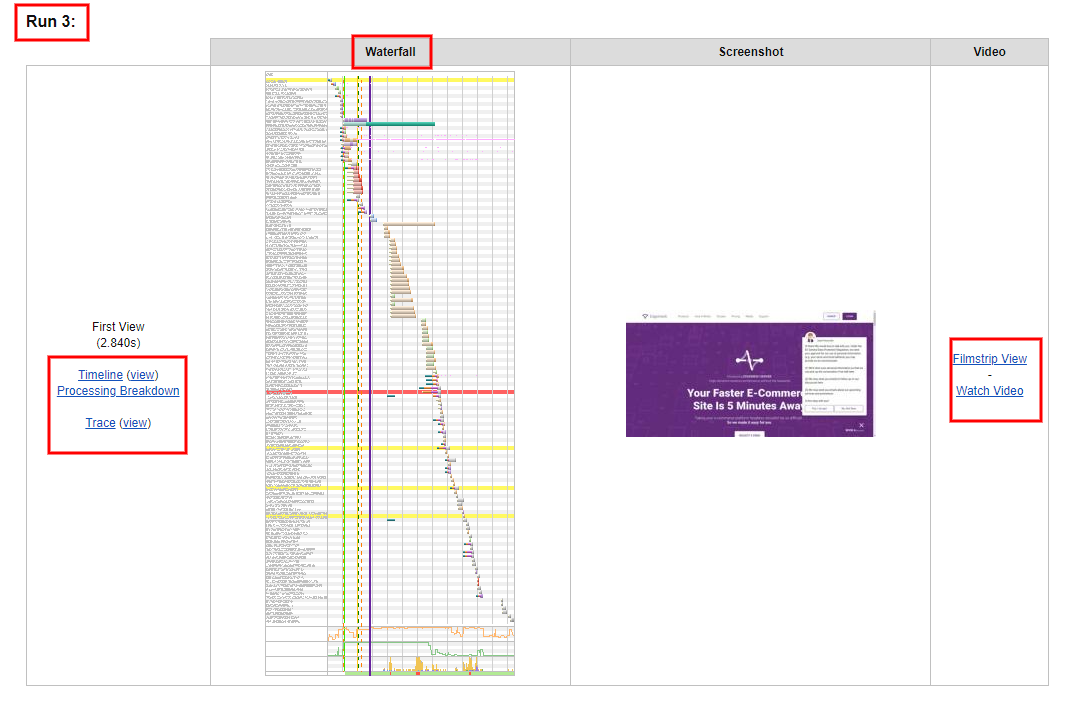
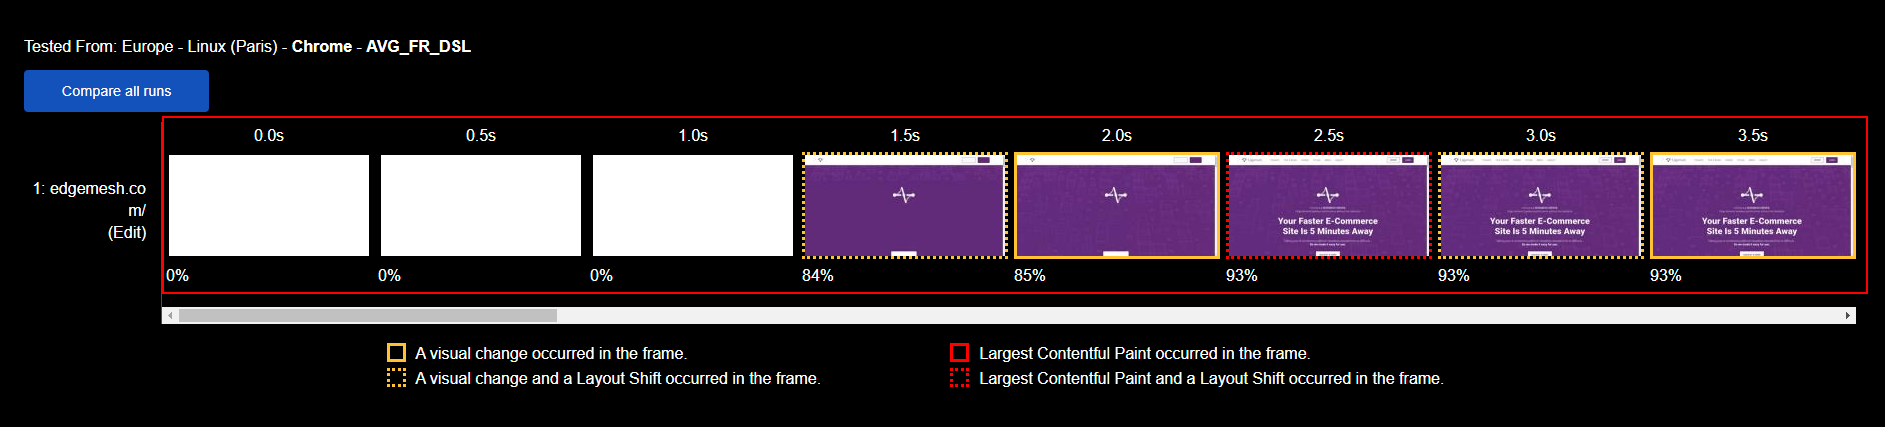
- Meanwhile, the filmstrip view results cover most details you need to know your start render time on each of the 3 runs.
Depending on the filmstrip view click for any of the runs (1, 2 or 3), you’ll get a filmstrip—or preferably a snapshot of your website at different rendering intervals.
- Since we’re running three tests, we’d compare all runs and see the changes in each.
Note: If you’re running more than 3 tests, you can do the same, but you can’t compare runs if you’re doing only 1 test.
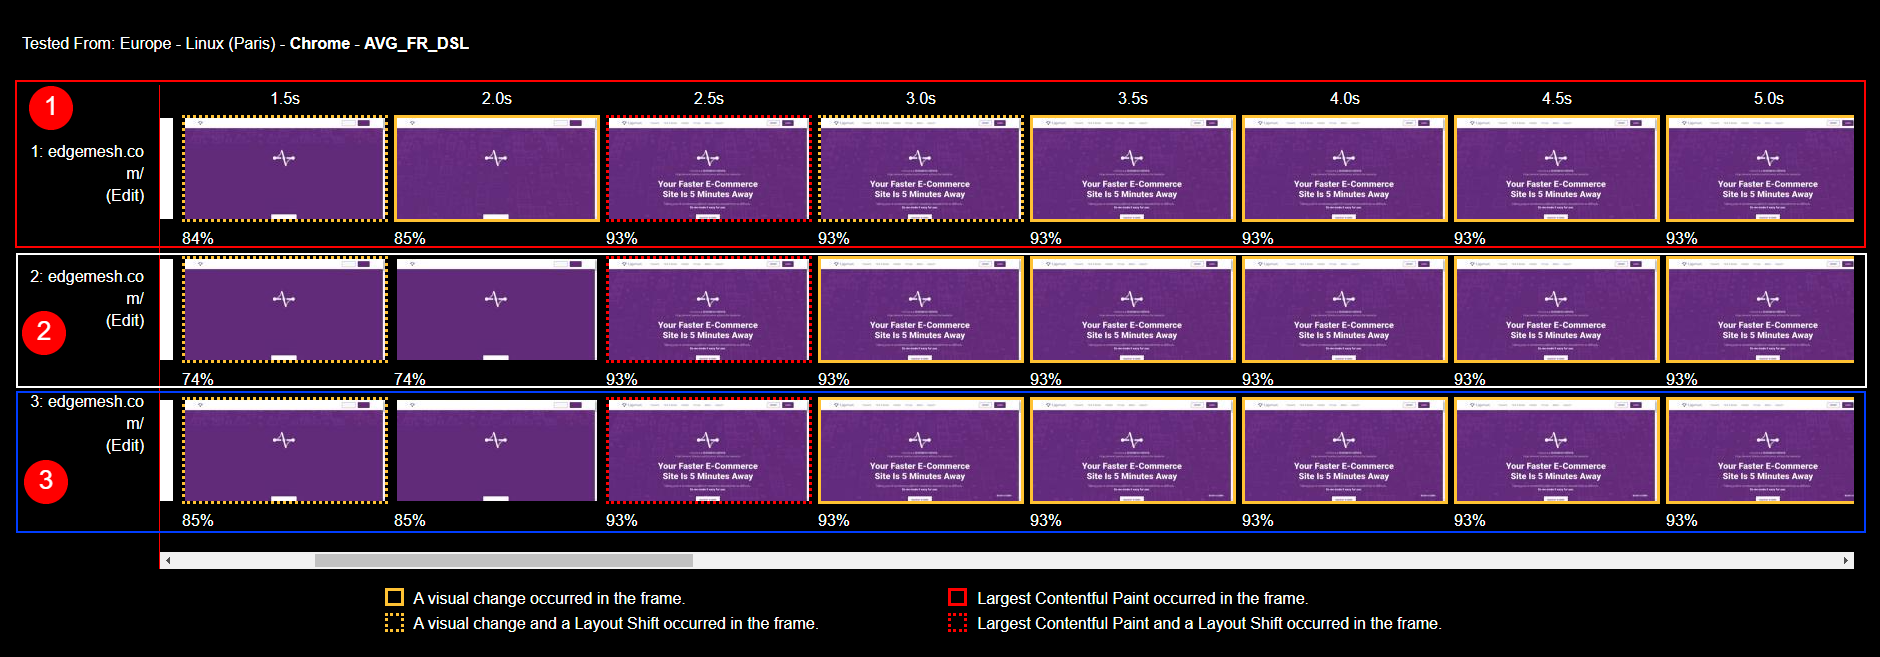
- With the results of each test, we can see the changes in each frame and how long it took for each frame to render to the user.
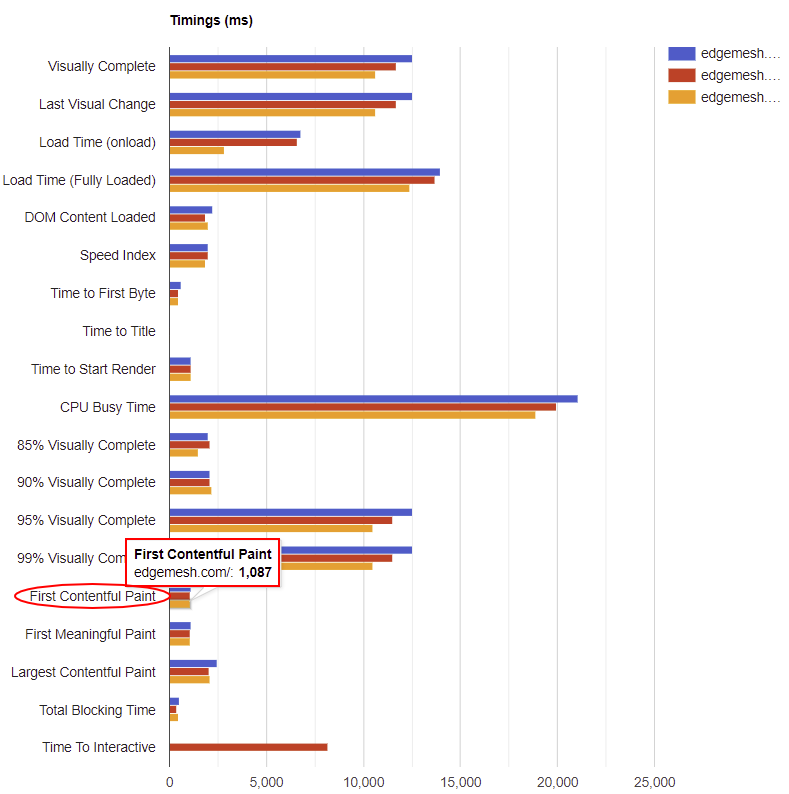
- To compare our start render time for each test, scroll down to “timings” and hover on “Time to start render.”

With these results, you’ll know if your start render time is good or bad. Remember, 1-2 seconds is the best start render time to provide an excellent user experience.
On the other hand, while using the WebPageTest tool, keep in mind the tool doesn’t accurately display the exact moment the first asset displays. In most cases, it’s 0.1s late in taking the snapshots—so your first asset might appear at 1.1s, but the tool records it at 1.2s.
Due to a slight measurement error, your First Contentful Paint (FCP), First Paint (FP), and Start Render Time will likely have the same result or similar—but they’re not actually the same.
Difference Between Start Render Time (SRT), First Paint (FP), and First Contentful Paint (FCP)
These three parameters’ primary function is to measure how fast a website starts displaying its content for users. Let’s first define FP and FCP.
First Paint (FP) is the time it takes the browser to render any pixel on the screen after a user navigates to a web page.

With FP, the user can only perceive the page is loading due to how content loads on their screens. Meanwhile, the user’s perspective is almost inaccurate because the browser solely determines it.
In some cases, when a website loads, the browser can render a First Paint that’s invisible to the user. A quick example is when an element renders with the same background as the website’s default background.
Due to errors like this, First Paint doesn’t guarantee accurate tracking of the user’s on-page experience in a website’s performance.
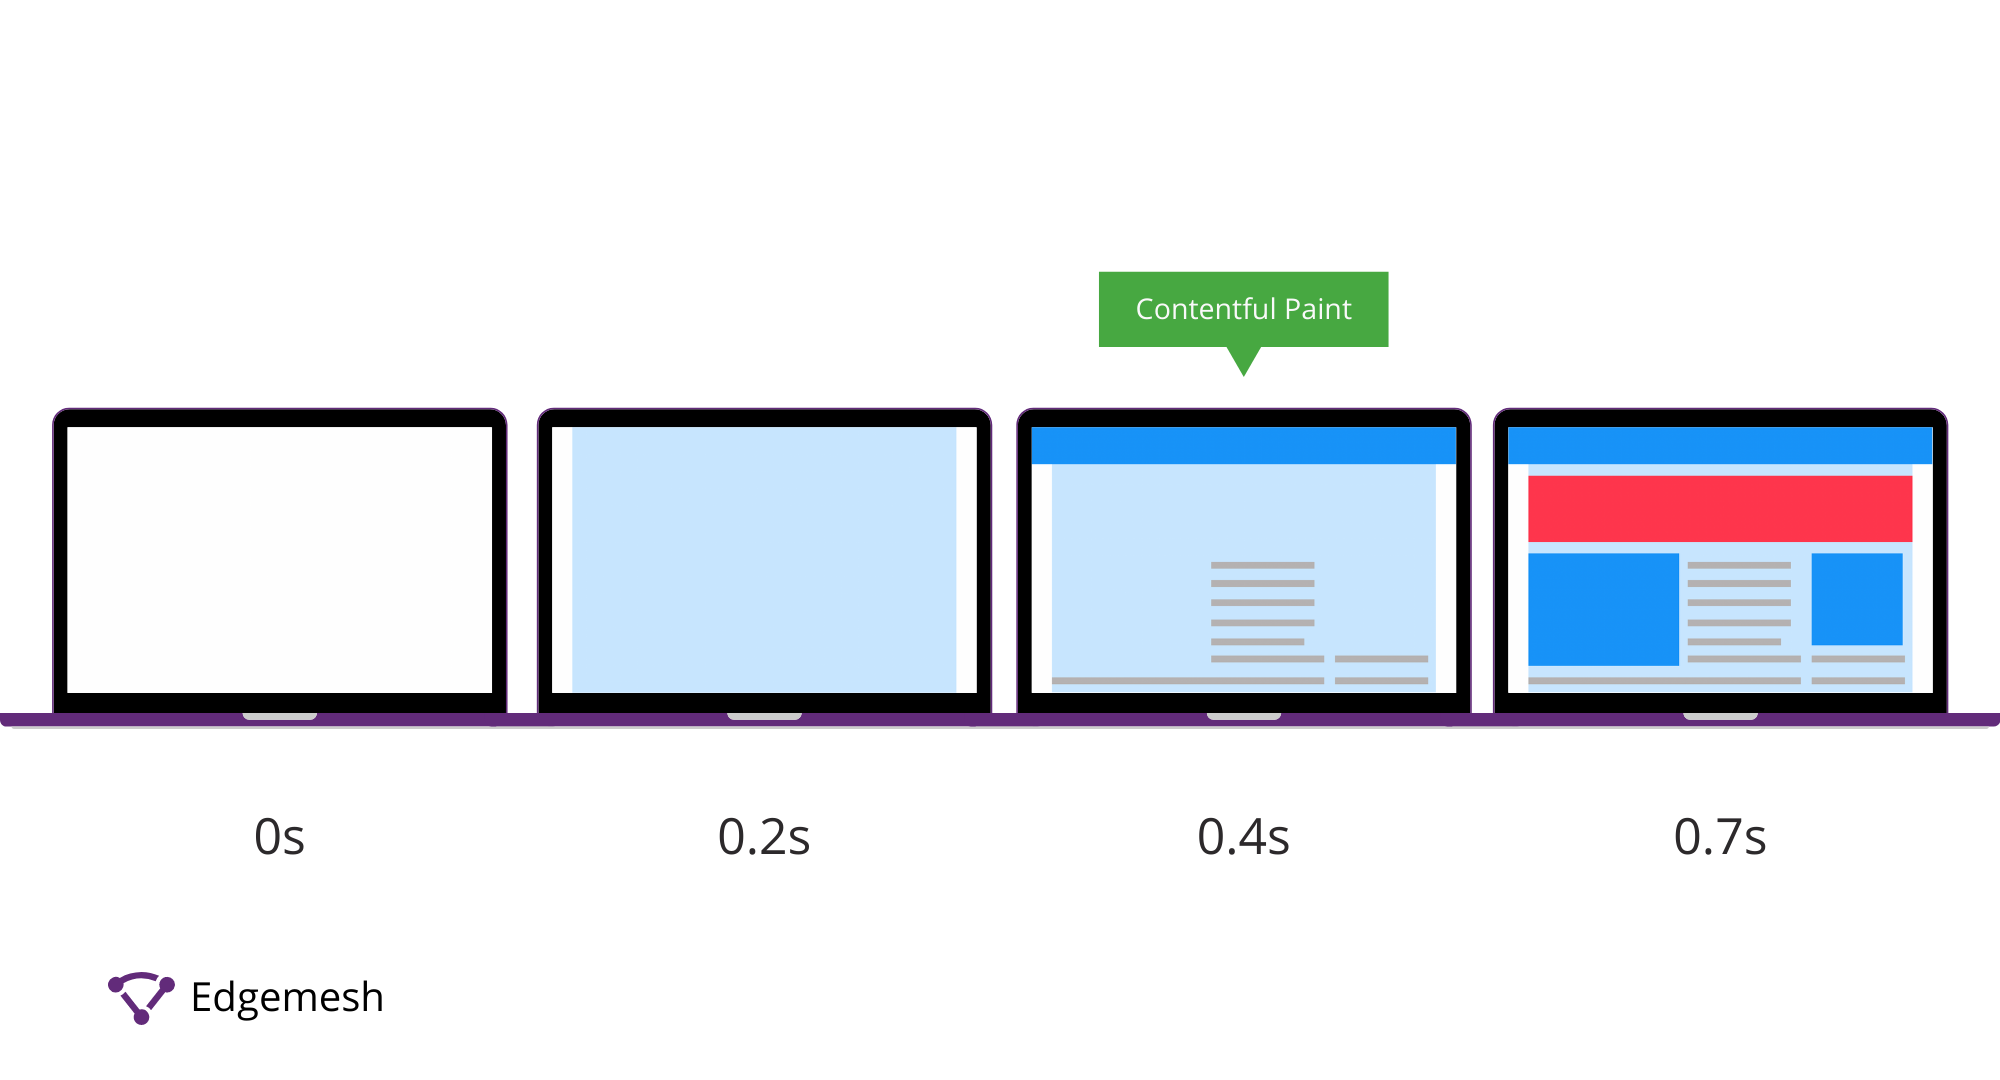
First Contentful Paint (FCP) is the time it takes the browser to first render any content from the DOM (images, texts, SVG, or non-white canvas) to the page.
Although FCP is a better metric for measuring how fast content loads on a website, it falls short in measuring certain elements. For example, FCP doesn’t take iframes and text nodes into account during a performance test. In most cases, it waits for the pending web fonts to render before it records the results.
This is a big issue for websites that use iframes and text nodes, as it gives a false result on the correct FCP score.
Another major problem with FCP: The metric doesn’t consider the user’s viewport during performance tests. With FCP, the metric only records “when” the first piece of visual content renders and not “where” it renders.
So, if the FCP of a website is below the fold and not visible to a user, it’ll still trigger FCP.
Nevertheless, First Contentful Paint provides better and more accurate results than First Paint—although their timing often ends up being the same, which is why Start Render Time is important.
Unlike FCP and FP, which are field data, Start Render Time uses synthetic monitoring tools via video analysis to track the exact moment users perceive the website loading in real-time.
The main benefit of Start Render Time over FCP and FP is that it avoids tracking “browser-generated” paints.
Meanwhile, the results are almost always the same regardless of their differences because they measure nearly the same thing.
A quick example from our earlier test:
Time to Start Render at 1,100ms
First Contentful Paint at 1,087ms
How to Improve Your Start Render Time
The loading process involves many requests from the browser to the server and vice-versa. With these requests, web pages tend to become larger due to the number of objects they need to parse and render each time.
Many of these objects load in the HEAD of HTML documents—all of which contribute to slow start render times. Five ways to improve your start render time include:
1. Minify Unnecessary Codes
In the front and backend of your website, specific Javascripts, CSS, and HTML commands are unnecessary to make your website function properly.
Multiple whitespaces, comments, returns, and other commands that don’t make any impact tend to clog your browser’s main thread. When this is clogged, there’s a response delay from the server to the browser—hence, a slow start render time.
Tools like YUI Compressor, MinifyCode, Refresh SF, and Prepros are perfect for helping you get rid of unnecessary codes.
2. Limit The Number of External Resources in the HEAD
External text fonts, animations, scripts, stylesheets, etc., loading in the HEAD of your HTML document delays your website’s rendering speed. Before any of these objects can render, the internal resources of the website have to go through.
But in cases where external resources are also present, it will take a long time to reach the main resource(s) that should immediately render a user opening the website.
An excellent way to fix this is to minimize the number of external resources the website needs before loading. We recommend you put CSS above your JavaScript to avoid obstructing the parallel loading of your CSS files.
3. Defer Loading Javascript
When users visit a website, the browser delivers the site’s HTML content, and in that process, it builds the DOM to allow other parts of the website to render until it’s complete.
If the browser finds any Javascript, it’ll stop building the DOM until it can fetch and parse the Javascript file—hence no rendering of other parts of the website until this is complete.
Depending on how much Javascript is on the website, this process will repeat for each script and thus, affect your start render time, page load time, and user experience. The best way to solve this is to defer loading Javascript, especially if there’s little to no need for it in the initial loading of the main page. This way, the browser will only parse Javascript files after the main content of your website finishes loading.
4. Make Use of HTTP/2 Protocol
Many websites prefer to shard their subdomains to improve download speeds of objects across their website—but HTTP/2 easily fixes this.
Compared to HTTP/1, the multiplexing feature in HTTP/2 makes downloading and serving objects more accessible and faster. This way, the browser doesn't have to request files from the server and wait to download.
However, setting up HTTP/2 can be a bit technical, but if you have a Content Delivery Network (CDN), you can simply toggle on HTTP/2 protocol in the backend and get your start render time up to a better speed.
With this, all your files are kept separate and spread across different networks, with the original copy on your primary server. So, when users visit your website, your browser’s main thread is clear to process all requests—boosting your start render time.
5. Cache on the Client-side
This is the best way to improve your start render time, especially if you run a dynamic website where your resources change frequently.
Caching your resources on the client side means storing the frequently requested files on your user’s browser. This way, they don’t need to reload the page from scratch; instead, they get a copy of the same page.
By storing copies of your web pages with your users, you save the browser from making unnecessary round trips to the server, eliminate server load, reduce bandwidth consumption, and most importantly, improve start render time.
Several tools can help you do this, but we recommend Edgemesh Server to help you get started in no time.
Using Edgemesh to Improve Start Render Time
User experience is the most crucial part of your website loading process. No matter how good the content, if it doesn’t load in the time it should, users will bounce.
Another issue is that your website loads quickly, but users have to spend the next few seconds staring at a blank screen. Start render time is all about the intervals between these delays. Your start render time is dependent on your server response time.
To improve your start render time, you need to improve how long it takes for your server to respond to requests from the browser. Using Edgemesh Server, the caching of your website is done on the client side via a service worker. This way, you can easily control which assets you want cached.
Here’s a quick case study involving deploying the Edgemesh server on a client’s website and measuring its impacts on start render time.
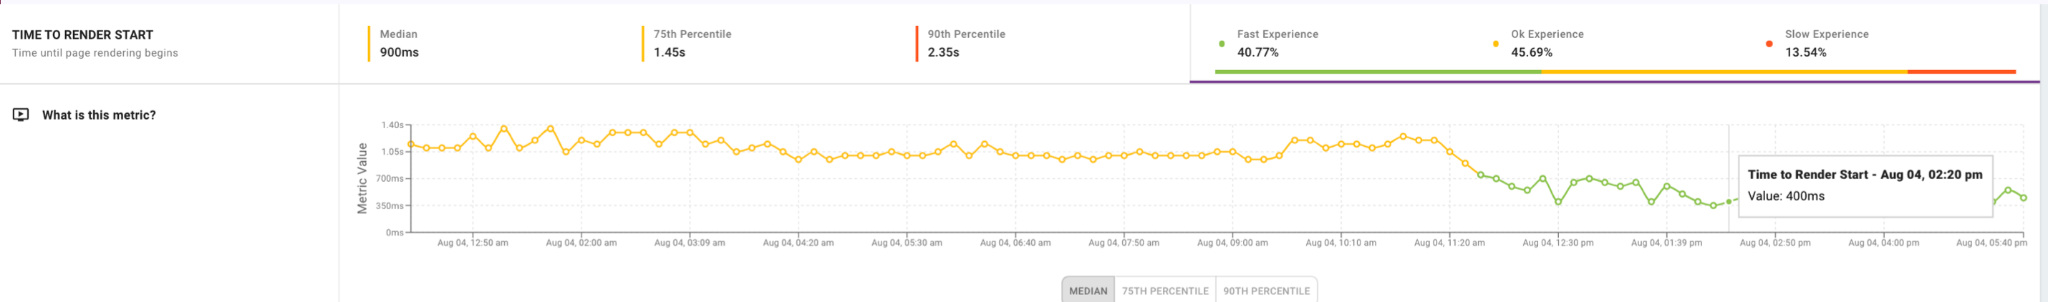
- The full deployment was at 11:15 am PST, and the chart below shows the summary of the impact of Edgemesh's server on the client’s website.
You can see noticeable changes from ranging around 57-60 page speed score to 95-100.
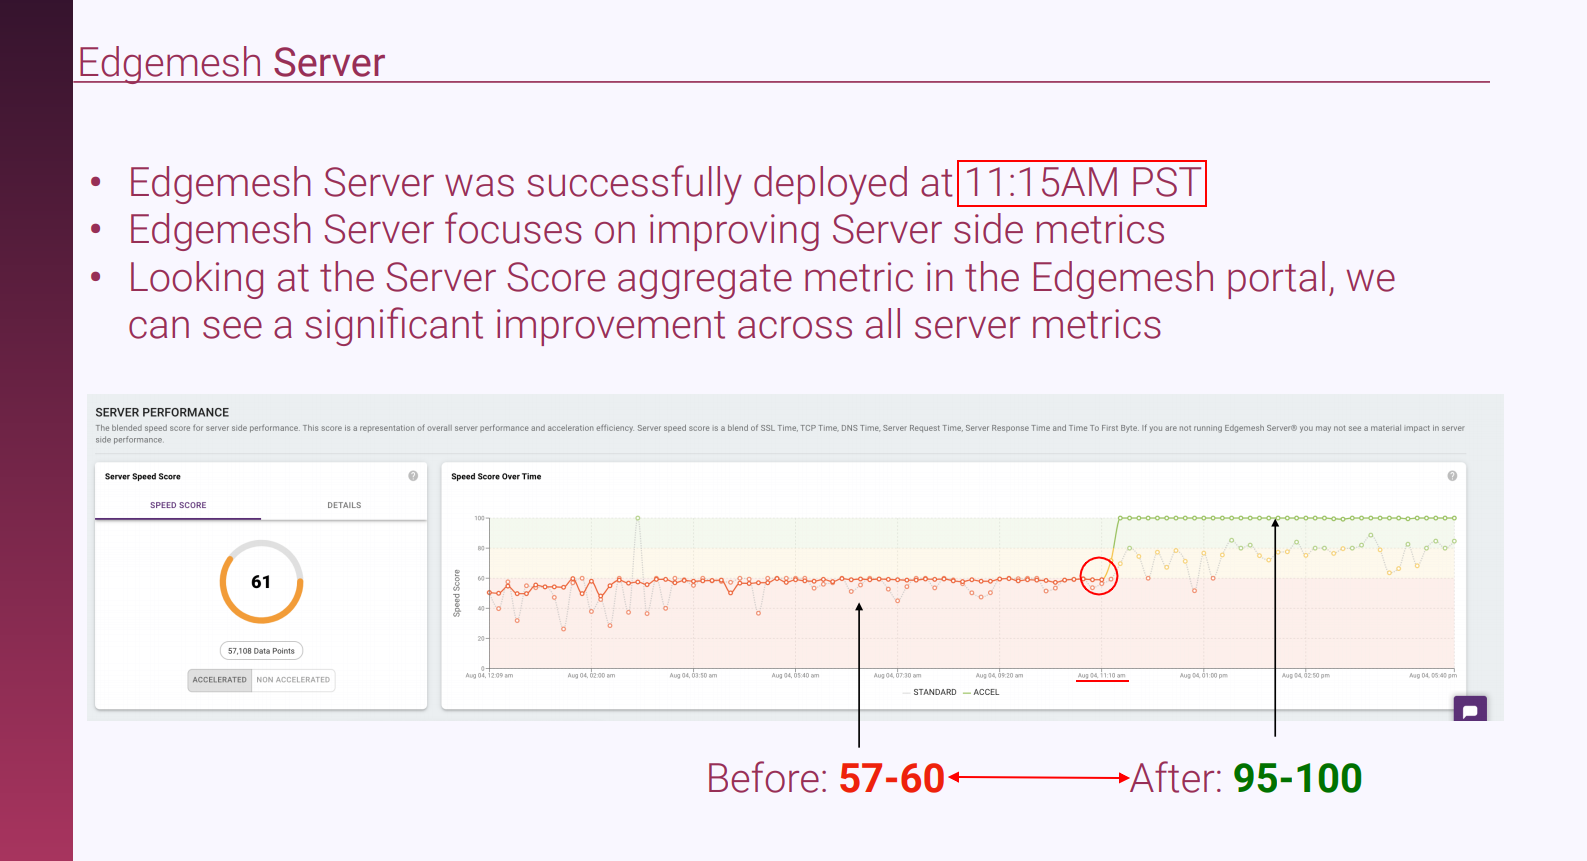
- Shifting our attention to start render time, a drop in server response time directly improves start render time.

Optimizing your start render time depends on the number of resources your website loads upon a user’s initial visit. Minimizing these numbers and prioritizing only those that help the website function will drastically improve your start render time.
If you made it to the end of this article, perhaps you’d be interested in the rest of this series.
Below are related articles we think you’ll find helpful:
The Complete Guide to Google’s Core Web Vitals: What is Largest Contentful Paint (LCP)?
Complete Guide on First Input Delay (FID)
What is Cumulative Layout Shift (CLS)?
What is Conversion Rate Optimization?
Do customer experience, good conversions, low bounce rates and overall—speed—matter to you? Then you’ll love Edgemesh’s Enterprise-Grade Web Acceleration.
Our intelligent, automated, and next-generation client-side caching readies your website to move at full speed—with just a single line of code.
Plus, it takes less than 5 minutes to set up. What do you say?
Start your 14-day trial to get a feel for what speed means to your business.


