
Have you ever visited a website, and while it's loading, you try clicking on an element, but it doesn’t work? Or you got lucky, and it worked after a few tries or responded to your input after a few seconds.
At that moment, you’re wondering—is the website broken? Does this work? Is it my network?
And for the most part, it’s none of that; instead, what you experienced is called a website’s TTI.
TTI stands for Time to Interactive, and it focuses on how fast a website responds to a user’s input when they visit a website.
In this article, we’ll take you through what TTI means, how it impacts your website performance, and how to measure and improve your TTI.
Let’s get right to it!
What is Time to Interactive (TTI)?
Time to Interactive (TTI) is a core web vital metric that measures how long it takes for a web page to be fully responsive after a user arrives on it.

According to Web Dev, TTI is the time it takes a web page to become fully interactive with a user. This occurs at a point when the last Long Task finishes and is followed by 5 seconds of network and inactivity on the main thread.

The basic concept of TTI is focused on the web page’s response to a user’s interaction.
The next question is—
When is a Web Page Considered Interactive?
A page is considered interactive when it fulfills three conditions:
- The page displays valuable content, which is measured by the First Contentful Paint
- Event handlers are registered for most visible page elements
- The page responds to user interaction within 50 milliseconds
Once all these conditions are met, users can interact with the web page.
Now let's break each of these conditions down.
First condition
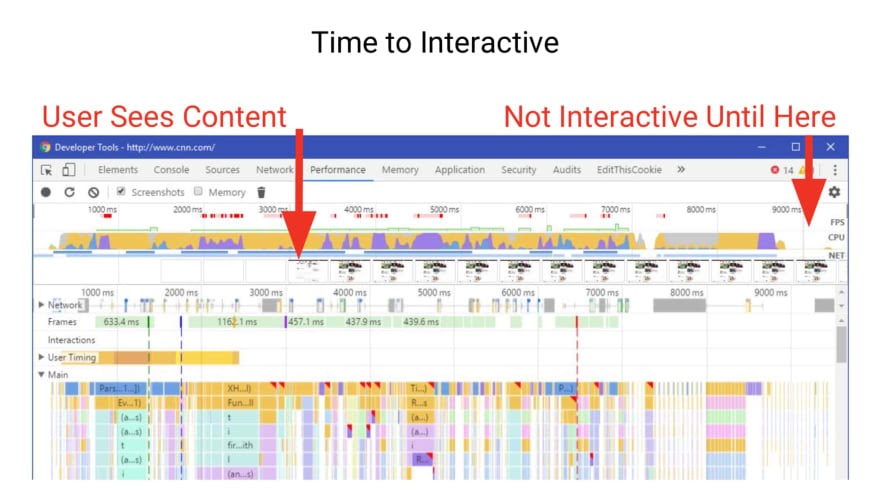
In order to achieve TTI, there’s a need to reach FCP. This is because FCP measures when a page starts displaying content. So, your TTI shouldn’t be far from your FCP—if it is, there’s a problem. Users will have content fully displayed on their screen but not be able to interact with it.

Source: Dev.to
Second condition
Event handlers on a website are responsible for every element or resource that makes a website function. A quick example of this is when you click on a button on a website, and it takes you to another page or responds to your interaction as a whole. Event handlers are responsible for making that button work.
Your website has to display content as fast as possible with this condition—and display it above the fold, preferably. All elements present must have event handlers registered to respond to users’ input.
Third condition
50ms is the mark for your website to respond to users’ input, and anything further creates a bad user experience. This is often difficult to achieve in most cases due to the time it takes the main thread to execute Long Tasks blocking it. This creates latency between the user’s input and the website’s response.
Inconsistencies in TTI Measurement
Over the past few years, Google has consistently reduced the efficiency of TTI in judging a website’s performance. This is due to an inaccurate differentiation between when the website is interactive—and when users can interact.
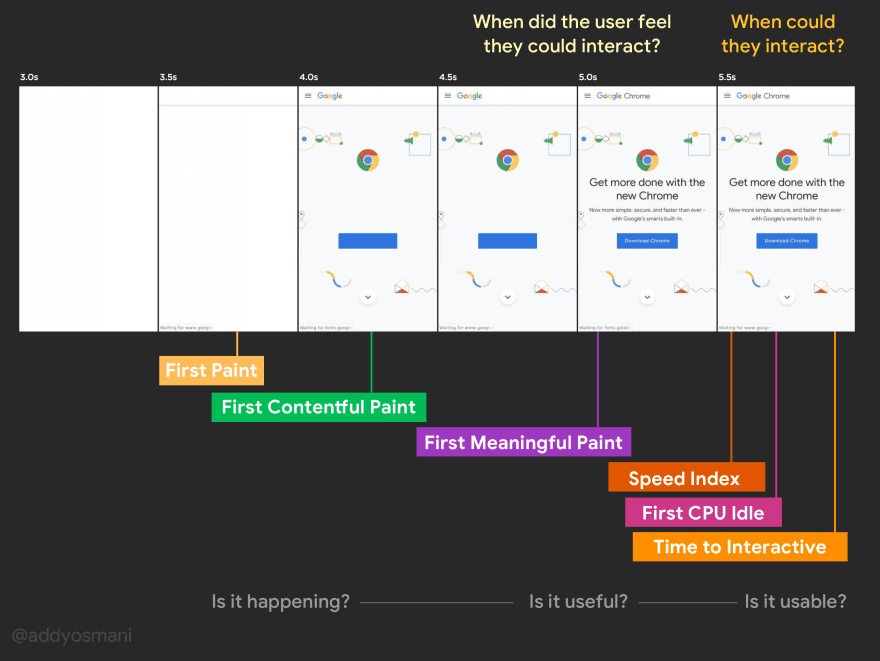
Source: Dev.to
In the image above, the time the user feels the website is interactive is not exactly the time it is. Although several factors are likely to be responsible for this, a large portion is caused by long tasks on the main thread.
What is a Long Task?
A long task is defined as all tasks on the browser’s main thread that exceeds 50ms. This is caused by Javascript files that failed to fully execute within the 50ms time frame—hence, stopping the responsiveness of your website’s element to the user’s input.
A quick example is this browser’s main thread of a loading event.

In the loading event above, there are five tasks (task 1-5), of which three (task 1,2 and 5) are long tasks because they exceed 50ms.
During a loading event, these long tasks will occur between the FCP and the TTI—in between this is the TBT (Total Blocking Time).
The sum of all long tasks exceeding 50ms on the main thread is what is called the TBT.
When all these long tasks accrue on the main thread, the time difference between a user’s input and the website’s response completely changes the purpose of TTI.

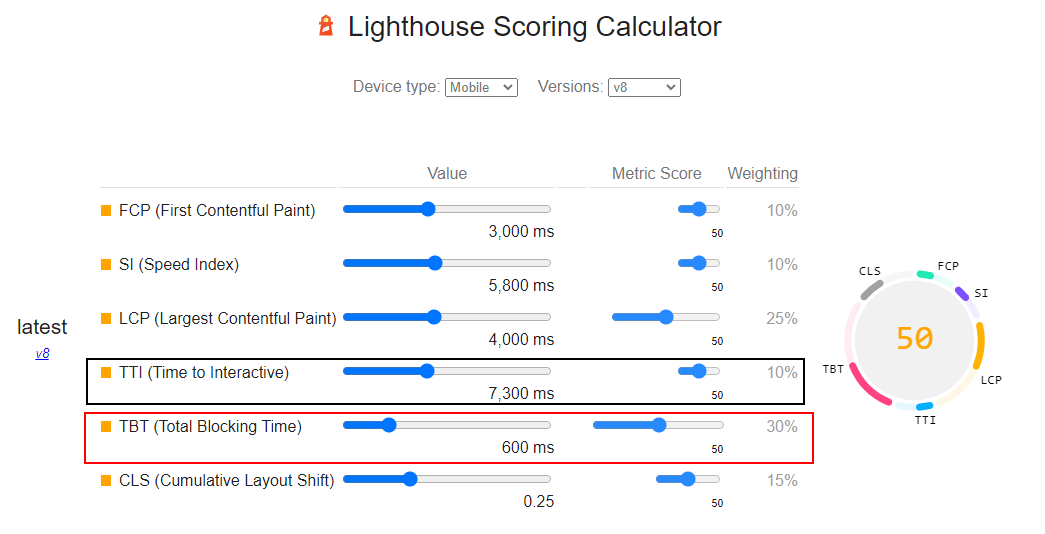
As a result, TBT has more impact on your overall website’s performance than TTI. For example, according to version 8 of Google’s Lighthouse Scoring Calculator on a website’s performance, the TBT occupies 30% of your overall score, while the TTI is only 10%.
How is TTI Calculated?
Calculating TTI correctly starts when the page finishes loading its First Contentful Paint—then, you have elements and resources on the page ready for interaction.
To do this, you can use Google’s Runtime Performance feature and follow these steps:
- Start at the First Contentful Paint (FCP).
- Search forward in time for a quiet window of at least 5 seconds, where quiet window is defined as no long tasks and no more than two in-flight networks GET requests.
- Search backward for the last long task before the quiet window, stopping at FCP if no long tasks are found.
- TTI is the end time of the last long task before the quiet window (or the same value as FCP if no tasks are found).
Here’s a diagram to give you a better visualization of the steps above:
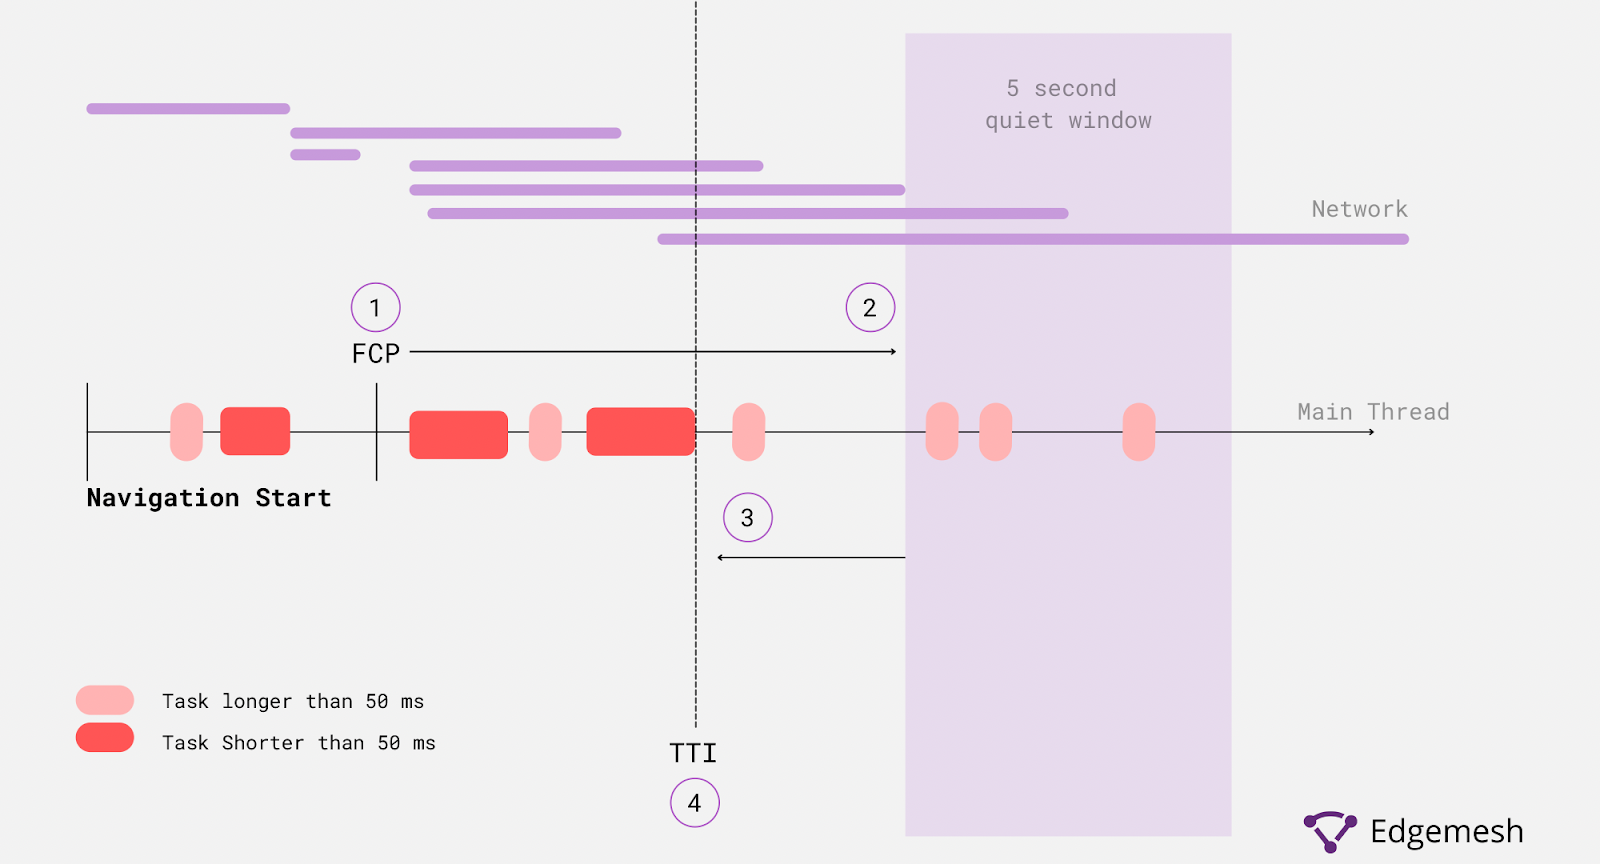
This means it’s impossible to estimate the TTI of a website before the analysis is complete.
Some web experts argue that calculating TTI should start from the First Meaningful Paint (FMP) instead of the FCP. But further clarification from the algorithm used for the calculation demonstrates why FMP isn’t a good option.
- Using the FMP as a lower bound is not recommended as it’s not yet standardized.
- It’s impossible to detect TTI when the network isn’t stable accurately—meanwhile, the actual TTI value will always be found at the end of a long task on the main thread.
- A minimum wait of 5 seconds is important before considering if a page is interactive.
- A page won’t be considered interactive if the DOM is incomplete. Thus, the TTI has to wait for the DOMContentLoadedEnd.
What is the Difference Between TTI and TBT?
Many mistake TBT for TTI, as they’re closely related to measuring web interactivity. Though they do almost the same thing, they’re quite different.
Time to Interactive (TTI) is the time it takes a web page to be fully interactive for a user’s input. Simply put, a page is considered interactive if there are no long tasks on the main thread for at least five seconds.
Total Blocking Time (TBT) is a web performance metric that measures a website’s unresponsiveness to the user’s input during a loading event.
Comparing these two metrics shows they have a similar goal—but a different approach.
TTI identifies the time it takes the web page to be interactive, while TBT identifies how long it took the website to be unresponsive to a user’s input during a loading event.
When you match both metrics, you get a clearer picture of how users experience your website. However, in context, TTI is more inclined to be a user-centric metric, as it focuses solely on the user interaction with a website.
What is the Difference Between TTI and First CPU Idle?
When it comes to understanding website responsibility, TTI and First CPU Idle are often confused for one another.
First CPU Idle is the time taken for the web page’s main thread to be quiet enough or have no running task to handle any input from a user. In the case of the First CPU idle, it only measures how long it takes resources of the website to be interactive before entering an idle state, while TTI measures how long it takes the whole website to be interactive.
What Is Good TTI Timing?
TTI timings are split into three categories, namely:
From 0 to 3.8 seconds—Green (fast)
From 3.9 to 7.3 seconds—Orange (moderate)
Higher than 7.3 seconds —Red (slow)
Aim for your TTI timing to be between 0 to 5 seconds at most to give you a better shot at giving users the best experience.
What Causes Slow TTI?
The primary cause of slow TTI timing is Long Tasks caused by existing Javascript on your browser’s main thread.
As said earlier, these Long Tasks are tasks exceeding 50ms—and when present on your main thread, blocks it from parsing other tasks until it finishes executing the long tasks. Furthermore, during the execution of these tasks, the browser can’t respond to the user's input—if a user clicks on anything on the website, the website won’t respond.

This is due to the delay in parsing and rendering other content, which is making your website’s interactivity with users slow. The most efficient way to get around this is to identify the long tasks on your main thread and find a working solution.
How To Find Long Tasks?
The best way to find long tasks causing slow TTI on your website is by doing a website performance audit. You can do this with either the built-in Dev Tools in your Google Chrome or other third-party tools.
In this article, we’d be using Chrome Dev Tools to find the long tasks of our website, Edgemesh.
Here’s the process to follow:
Go to your preferred address; in this case, ours is Edgemesh.com
If you’re using Windows, use these combinations—CTRL + SHIFT + I
If you’re on a Mac, use these combinations—CMD + OPT + I
You should have something like this if you did it correctly 👇
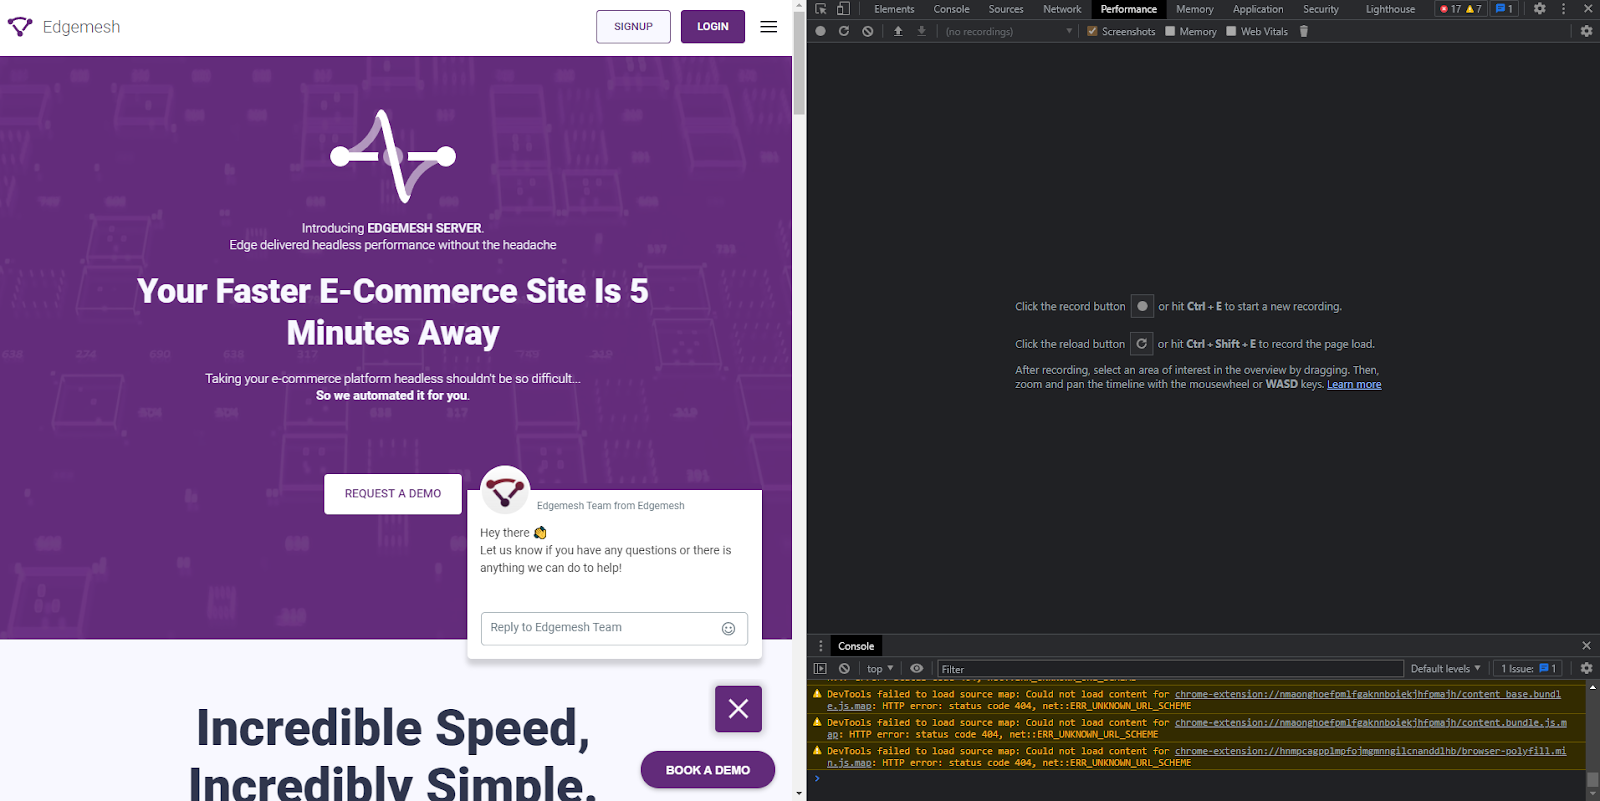
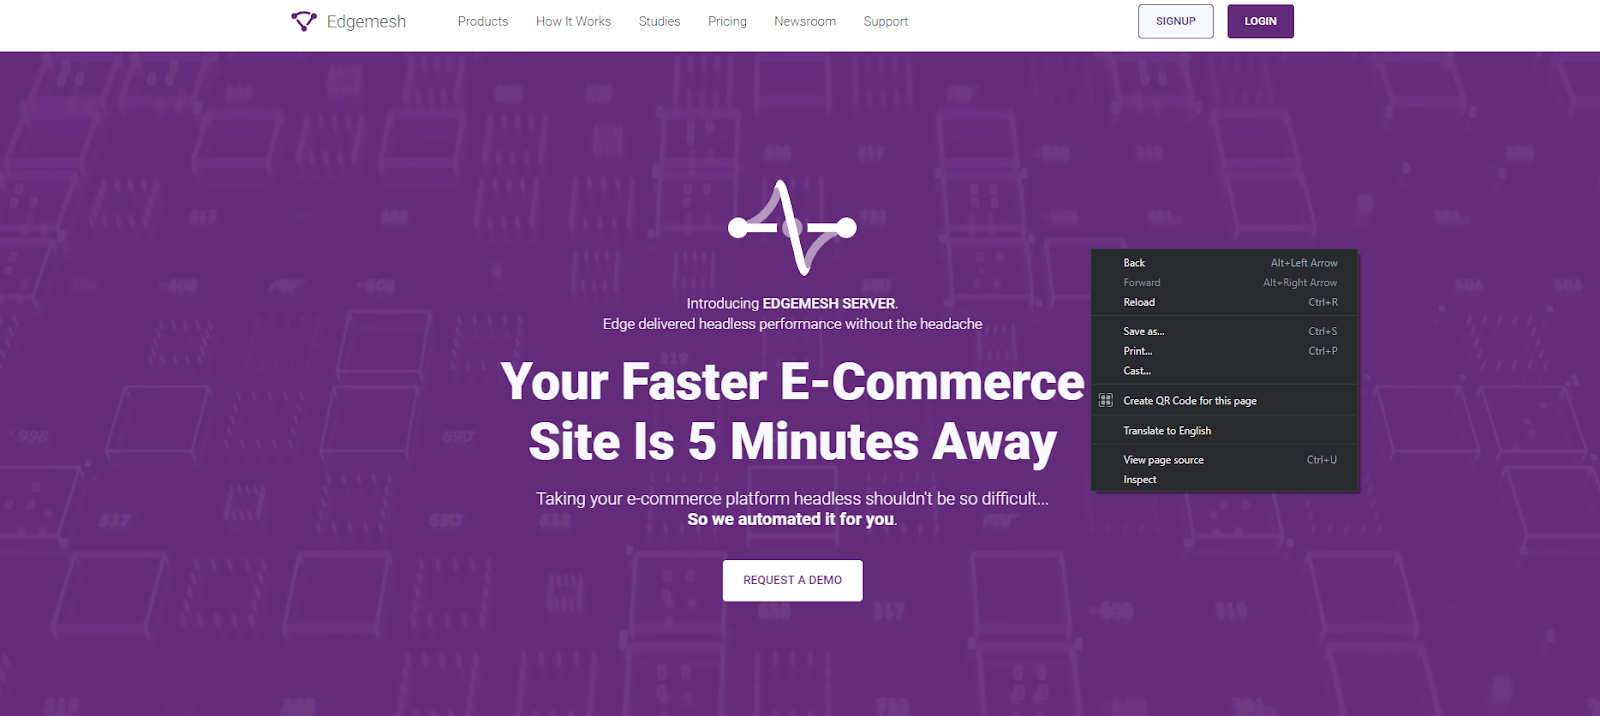
Or better still, right-click on your mouse, scroll down, and click inspect.
- Click on the reload button to perform another page load so the tool can record your website’s performance. Again, hit reload, and you should have a screen like this:

- Scroll down to Main and click to get a dropdown of the entire loading event. With this, you’ll take note of the Long Tasks on the main thread during the loading activity.
—There are several tasks on the main thread and are distinguishable with a grey color; these fall under 50ms.
—If you see an extra overlay or shade of red on the task, then the additional overlay is a Long Task.
Here’s what we’re talking about:
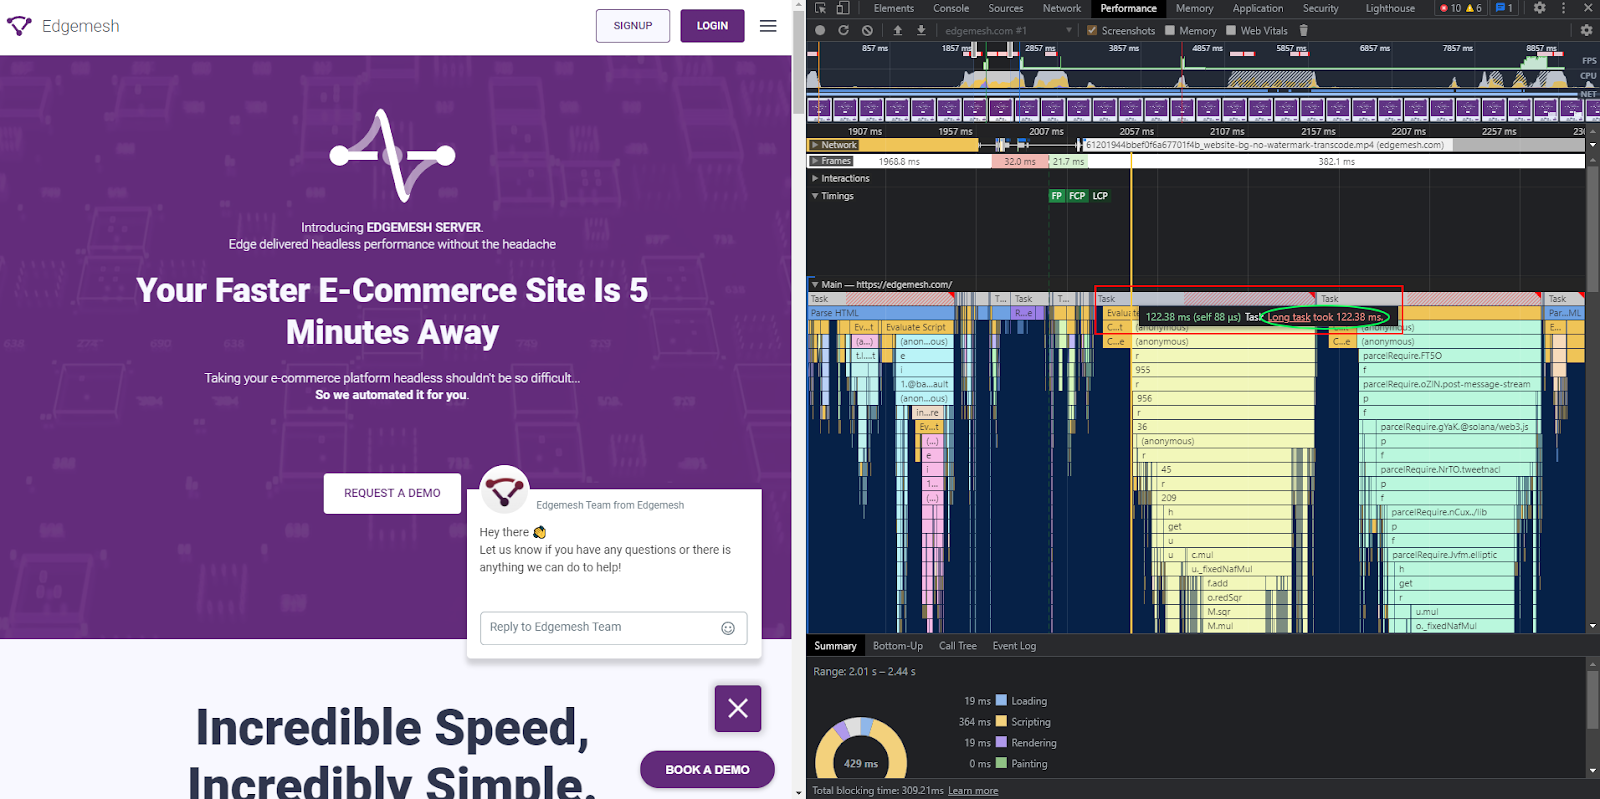
- The overview of each event is a task on the main thread, all of which make up the entire loading event of your website.
Below the whole loading event is a detailed description of each task from initiation to execution.
For example, when we click on our earlier task and navigate to Bottom-up, we get a breakdown of all Javascript involved in the task execution.
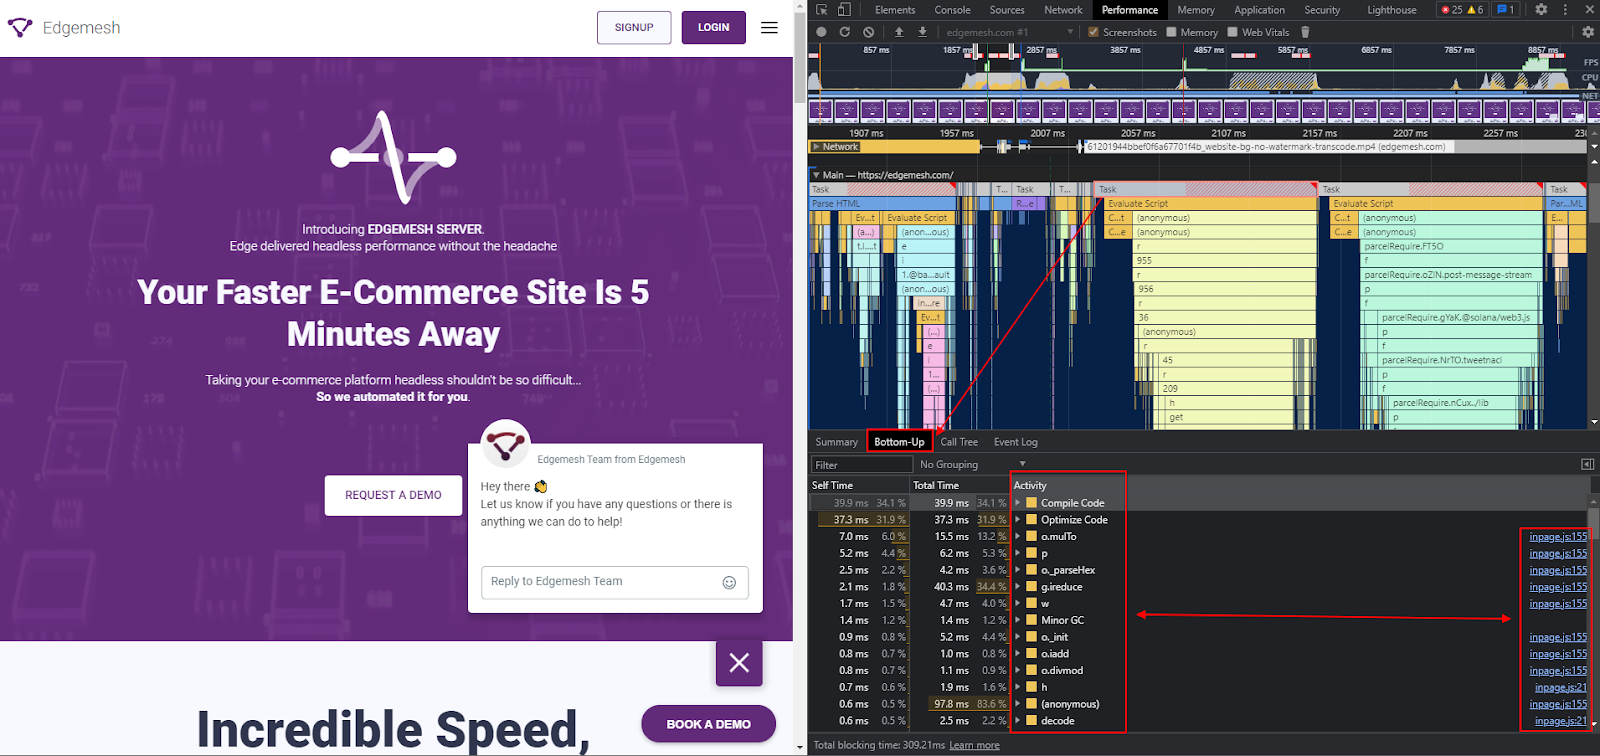
Here, you can take the time to go through every line of code to understand what is causing the long task and either remove them entirely or split them into smaller tasks.
5 Ways To Improve Your Slow TTI
Improving your website’s TTI primarily relies on how best you can handle the loading event on the main event. Considering that website resources, elements, and content function based on the execution of their respective tasks, your best strategy is to implement ways to make such tasks an easy one on the main thread.
Below are five ways you can improve your slow TTI:
1. Minify Unused JavaScript and CSS
Both JS and CSS and codes make your website function. CSS makes up the part of styling your website, while JS is responsible for how the elements on the website function.
In writing these codes, punctuations, lines, marks, and some unnecessary parts can create clutter blocking the main thread from executing its task. Minifying your code is the best solution in this scenario, as it gives your main thread the ability to quickly identify the critical content to render to the user.
If you’re curious about finding your used and unused code, use the Coverage Tab in ChromeDev Tools.
- Like earlier, follow the same process to get to Chrome Dev Tools — either CTRL + SHIFT + I for Windows or CMD + OPT + I for Mac.
- Once the Dev Tools window pops up, scroll to Sources and use CTRL + SHIFT + P to run a command.
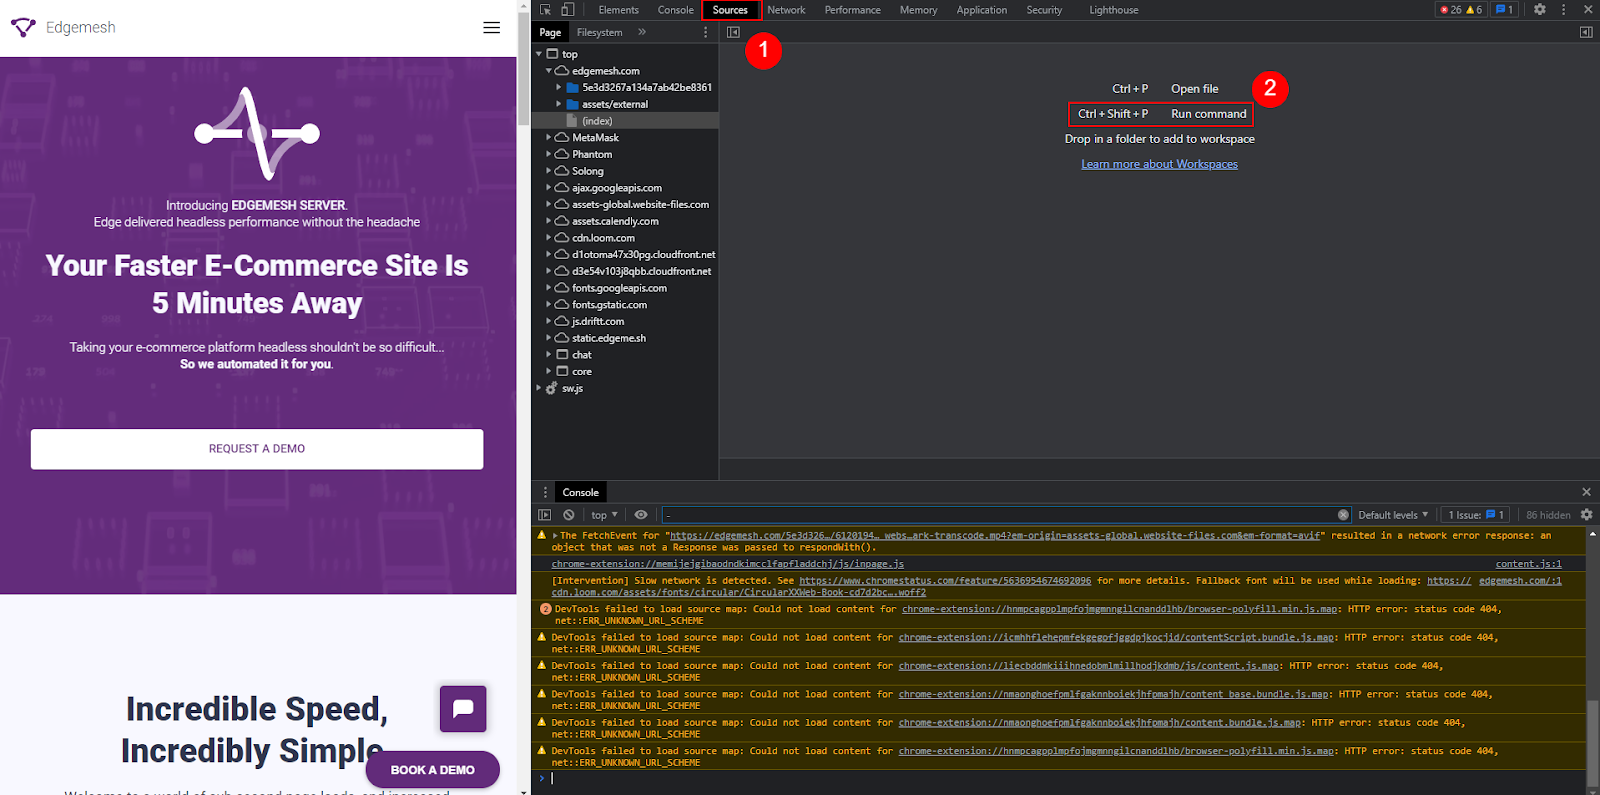
- Once you click and run the command, a mini search window should pop up on the top bar—once you see this, type in coverage.

- Click on show coverage.
- Then click on the reload button to capture the code needed to load the page.
Here’s what you’ll have:
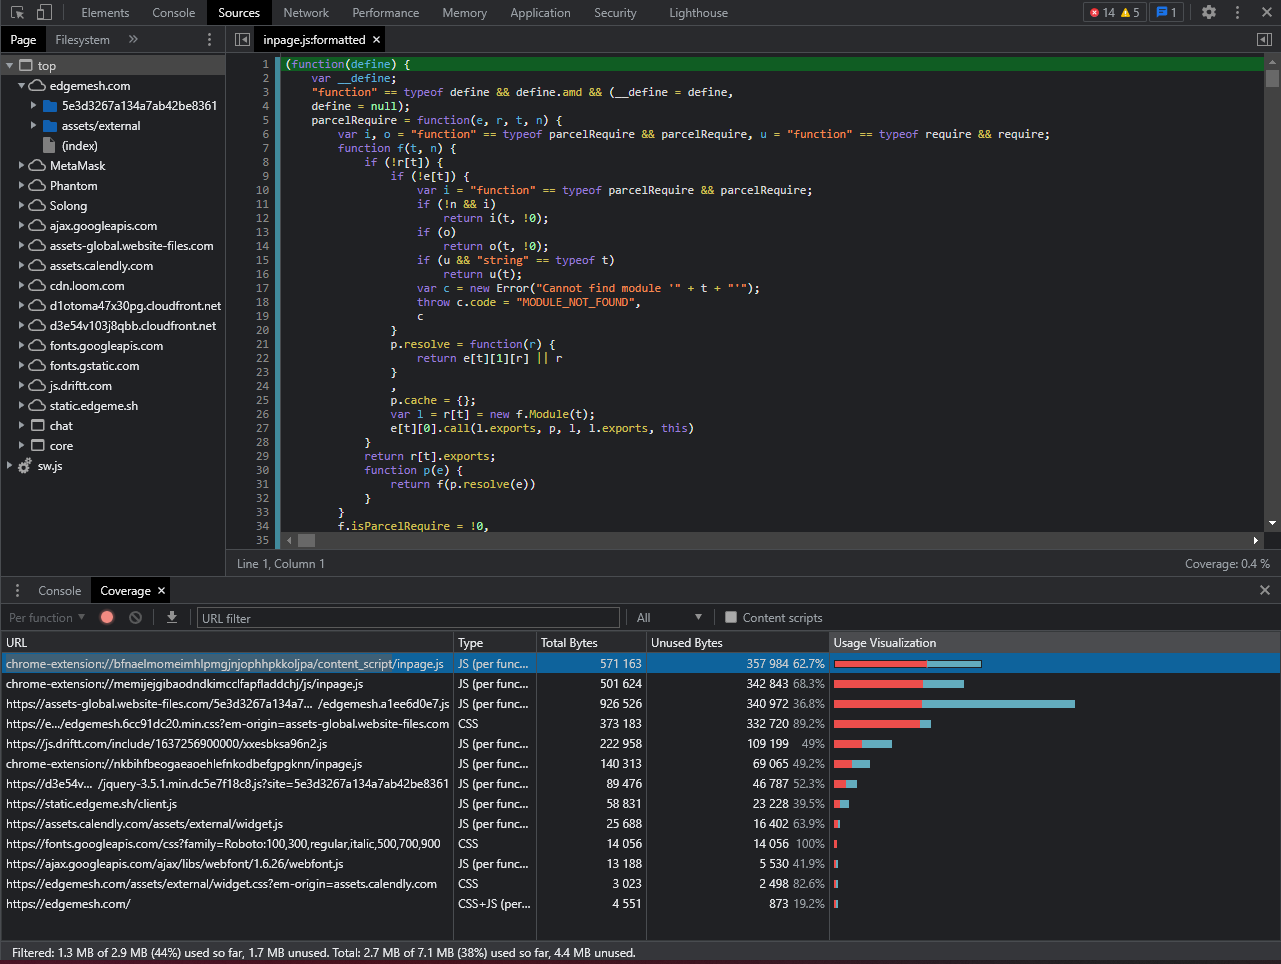
As you can see, five columns show each code was used to load the page completely.
Let’s break down each column:
- The URL column shows the URL of the resource that was analyzed
- The Type column says whether the resource you’re analyzing is JS, CSS, or both
- The Total Bytes column shows the total size of the resource in bytes
- Finally, the Unused Bytes column is the number of bytes not used in loading the page—it also includes it in the percent
- The Usage Visualization column shows the sum of Total Bytes and Unused Bytes—with the red section of the bar being unused bytes, while the sky blue section is used bytes.
Once you figure this out, it’s best to get a web developer to help you rewrite your code and remove unnecessary lines—some of which might include comments, white spaces, new line indentations, etc.
If you’re using WordPress, you can use plugins that help you shorten your code in the best way possible. Some of them include:
- YUI Compressor Tool
- WP Rocket
- WP Super Minify
- Closure Compiler (Google)
- Autoptimize
- Fast Velocity Minify
- UNCSS
2. Split Your JS Code
TTI focuses on how fast a website can interact with a user—and to make your website interact with users, Javascript is your biggest companion.
Not all of your JS code impacts the interactivity of your website—only a fraction is responsible for that. A way to do this is to split your code into two sections: One section is responsible for above-the-fold content; the other half is responsible for below-the-fold content.
The reason for this: Most users will interact with above-the-fold content before considering the one below. So, the first section of your code will handle the immediate rendering of your page, and the main thread will treat it as a priority.
Meanwhile, the other section will handle the other part of the website, and that’s where you store non-critical JS and CSS files that don’t impact how your page looks or loads.
3. Defer JS
Deferring JS code works in line with splitting your code. By deferring your JS, you’re telling browsers to load your most important content first before anything else. Doing this helps you reduce the time spent compiling and parsing JS files—this way, there are little to no long tasks on the main thread blocking the execution of other tasks.
4. Remove Unused CSS and Delay JS
Removing unused CSS creates a way to simplify the number of CSS files the DOM has to render to the user, making the page load faster and improving TTI. Also, delaying JS is another significant upgrade to improving your TTI. The idea here is to delay the loading of your JS files until the user requests them.
For example, when a user visits your website, there’s a Buy button on the page. Typically, javascript is needed to make the button function. The Javascript needed to make the button function on a regular website loads along with the website during the loading event. With this method, all other code will load except JS, so they remain dormant until there’s an interaction from the user that initiates a response.
5. Improve Server Response Time (Time to First Byte (TTFB))
Your website’s performance, TTI included, will only be as fast as the server handling it. A visit to your website from a user sends a request to your server, and it needs a response. So, if your website can respond to users’ requests as fast as possible, then the main thread will process interactions more quickly than usual.
Some of the ways you can improve your server response time are:
- Reducing network latency
- Improving DNS response time
- Increase server handling of high web traffic
- Use client-side caching.
Overall, TTI is highly dependent on handling Long Tasks on your main thread—the best way to do this is to focus on improving your Javascript files.
Related: What is Time to First Byte (TTFB)?
Wrapping Up
TTI is a complicated metric that involves careful observation before making any changes. So we advise you to take the time to monitor user interaction on your website and record their experience.
Also, try to go through your code at different intervals, perhaps after adding a new plugin or upgrading to a new host. Remember, TTI is a user-centric metric, so user experience should be your priority. We’ve given you all you’ll need to handle the situation if you notice your TTI score is below what’s recommended.
Questions about this article or your website? Feel free to leave a comment or reach out to us.
Related: What is Total Blocking Time (TBT)?
If you made it to the end of this article, then you’d be interested in the rest of this series.
Below are related articles we think you’ll find helpful:
The Complete Guide to Google’s Core Web Vitals: What is Largest Contentful Paint (LCP)?
Complete Guide on First Input Delay (FID)
What is Cumulative Layout Shift (CLS)?
What is Conversion Rate Optimization?
Do customer experience, good conversions, low bounce rates and overall, speed matter to you? Then you’ll love Edgemesh’s Enterprise-Grade Web Acceleration.
Our intelligent, automated, and next-generation client-side caching readies your website to move at full speed—with just a single line of code. Plus, it takes under 5 minutes to set up.
What do you say?
Start your 14-day trial to get a feel for what page speed means to your business.


